La Désirade monthly weather averages
Average daytime temperature
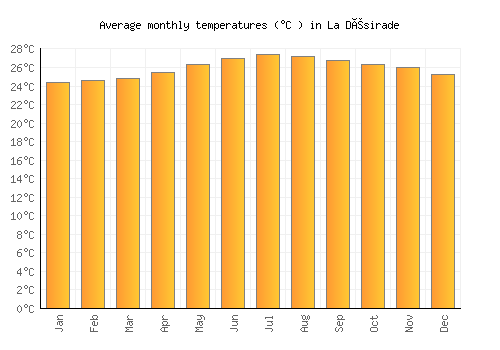
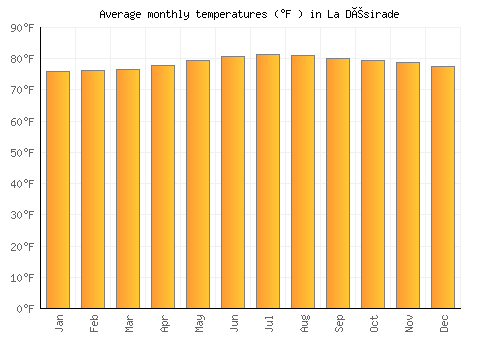
The bar chart below shows the average monthly peak daytime temperatures at La Désirade
| Jan | Feb | Mar | Apr | May | Jun | Jul | Aug | Sep | Oct | Nov | Dec | |
|---|---|---|---|---|---|---|---|---|---|---|---|---|
| °C | 28.3 | 28.5 | 28.7 | 29.2 | 29.7 | 30.3 | 30.7 | 30.7 | 30.3 | 29.9 | 29.7 | 28.9 |
| °F | 82.9 | 83.2 | 83.6 | 84.6 | 85.4 | 86.6 | 87.3 | 87.2 | 86.5 | 85.8 | 85.4 | 84 |
Please note: these are the average peak daytime temperatures (usually around mid-afternoon) so do not show daytime / night highs and lows. To see the daily range of temperatures have a look at the temperature max / min chart below.
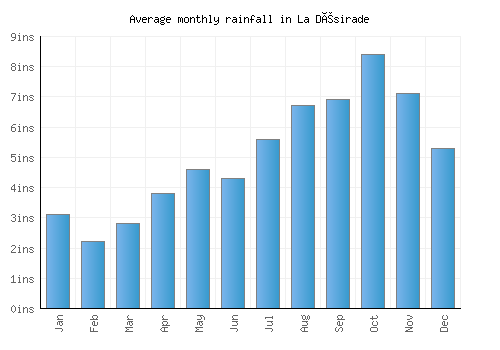
Average rainfall & rainy days
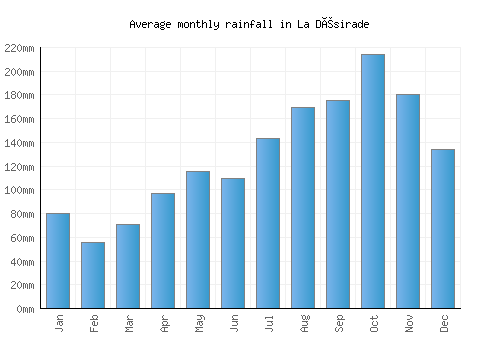
The graph below shows the average rainfall and number of rainy days per month.
| Jan | Feb | Mar | Apr | May | Jun | Jul | Aug | Sep | Oct | Nov | Dec | |
|---|---|---|---|---|---|---|---|---|---|---|---|---|
| mm | 80 | 56 | 71 | 97 | 116 | 110 | 143 | 170 | 175 | 214 | 181 | 134 |
| inches | 3.1 | 2.2 | 2.8 | 3.8 | 4.6 | 4.3 | 5.6 | 6.7 | 6.9 | 8.4 | 7.1 | 5.3 |
| Rainy days | 16 | 13 | 13 | 13 | 15 | 15 | 17 | 18 | 18 | 19 | 18 | 17 |
Average annual rainfall in La Désirade: 1499.9mm (590.5 inches)
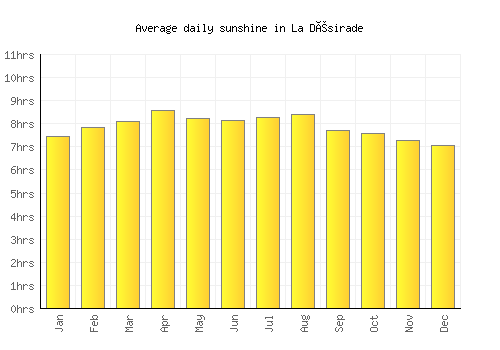
Average daily sunshine
The bar chart below shows the average daily sunshine hours in La Désirade
| Jan | Feb | Mar | Apr | May | Jun | Jul | Aug | Sep | Oct | Nov | Dec | |
|---|---|---|---|---|---|---|---|---|---|---|---|---|
| Hrs sunshine | 7.5 | 7.8 | 8.1 | 8.6 | 8.2 | 8.2 | 8.3 | 8.4 | 7.7 | 7.6 | 7.3 | 7 |
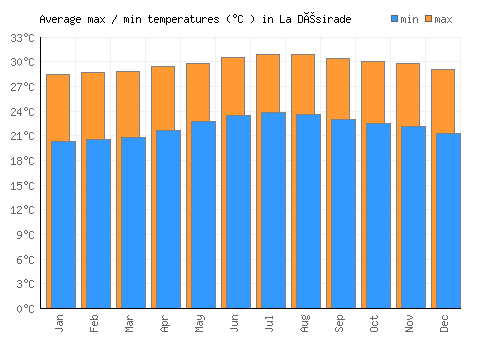
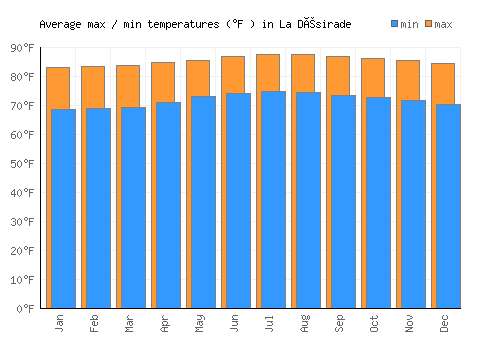
Day / night temperatures
The graph below shows the daily range of temperatures for each month.
| Jan | Feb | Mar | Apr | May | Jun | Jul | Aug | Sep | Oct | Nov | Dec | |
|---|---|---|---|---|---|---|---|---|---|---|---|---|
| Min °C | 20.4 | 20.6 | 20.8 | 21.6 | 22.8 | 23.5 | 23.9 | 23.6 | 23 | 22.6 | 22.2 | 21.3 |
| Max °C | 28.5 | 28.7 | 28.9 | 29.4 | 29.9 | 30.5 | 30.9 | 30.9 | 30.5 | 30.1 | 29.9 | 29.1 |
| Min °F | 68.6 | 69 | 69.4 | 70.9 | 73 | 74.3 | 75 | 74.4 | 73.3 | 72.6 | 71.9 | 70.3 |
| Max °F | 75.9 | 76.3 | 76.6 | 77.9 | 79.3 | 80.6 | 81.3 | 81 | 80.1 | 79.3 | 78.8 | 77.4 |
Sea temperature
The graph below shows the average sea temperature.
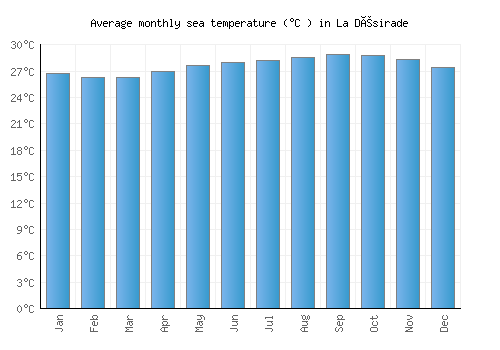
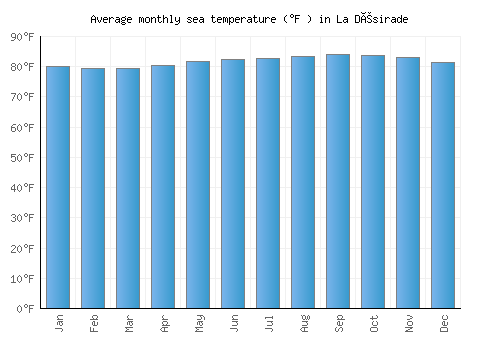
| Jan | Feb | Mar | Apr | May | Jun | Jul | Aug | Sep | Oct | Nov | Dec | |
|---|---|---|---|---|---|---|---|---|---|---|---|---|
| °C | 26.7 | 26.3 | 26.3 | 27 | 27.6 | 28 | 28.2 | 28.6 | 28.9 | 28.8 | 28.3 | 27.4 |
| °F | 80 | 79.4 | 79.4 | 80.5 | 81.7 | 82.5 | 82.8 | 83.5 | 84 | 83.8 | 82.9 | 81.4 |
Wind speed
The graph below shows the average wind speed.
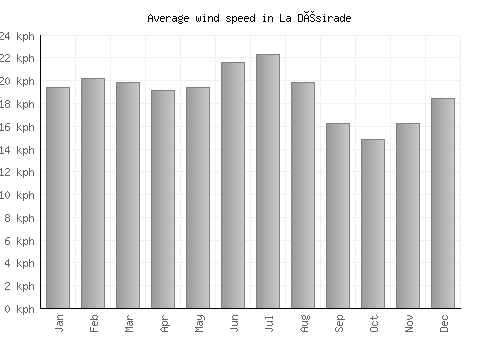
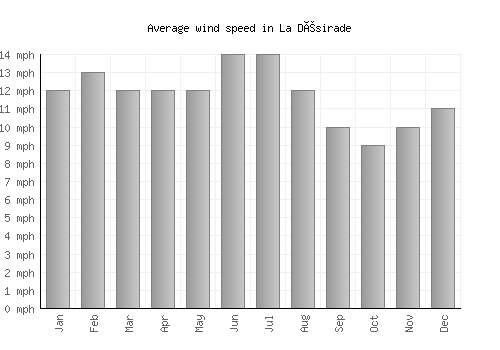
| Jan | Feb | Mar | Apr | May | Jun | Jul | Aug | Sep | Oct | Nov | Dec | |
|---|---|---|---|---|---|---|---|---|---|---|---|---|
| km/h | 19 | 20 | 20 | 19 | 19 | 22 | 22 | 20 | 16 | 15 | 16 | 18 |
| mph | 12 | 13 | 12 | 12 | 12 | 14 | 14 | 12 | 10 | 9 | 10 | 11 |
A monthly average windspeed of over 16km/h or 10mph suggests a location is fairly windy.
Relative humidity
The graph below shows the average relative humidity.
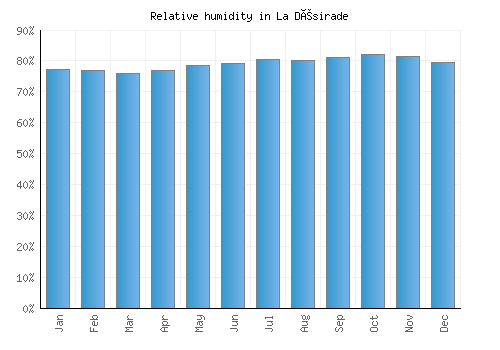
| Jan | Feb | Mar | Apr | May | Jun | Jul | Aug | Sep | Oct | Nov | Dec |
|---|---|---|---|---|---|---|---|---|---|---|---|
| 77% | 77% | 76% | 77% | 78% | 79% | 80% | 80% | 81% | 82% | 82% | 80% |
Other monthly averages
La Désirade weather stats
| Hottest month: | July | 30.7°C 87.3°F |
|---|---|---|
| Driest month: | February | 56mm 2.2ins |
| Sunniest month: | April | 8.6hrs |
| Coldest month: | January | 28.3°C 82.9°F |
| Wettest month: | October | 214mm 8.4ins |
| Warmest sea: | September | 28.9°C 84°F |