Nairobi monthly weather averages
What's the weather like in Nairobi?
Nairobi has a subtropical highland climate (Cwb) under the Köppen climate classification. This means that it is warm/temperate with cool to cold evenings. The city is located at an elevation of 1,795 meters (5,889 ft), which helps to moderate the temperatures.
The warmest month of the year in Nairobi is February, with an average temperature of 20.5 °C (69 °F). The coldest month is July, with an average temperature of 16.5 °C (62 °F). The city receives an average of 1,000 mm (39 in) of rainfall per year, which is is quite concentrated over two main rainy seasons: the long rains from March to May and the short rains from October to November.
The best time to visit Nairobi is during the dry season, which runs from June to October. During this time, the weather is warm and sunny, with very little rain. However, it is important to note that the city can still be quite hot during the day, so it is important to stay hydrated and wear sunscreen.
If you are planning to visit Nairobi during the rainy season, don't forget to pack a raincoat and umbrella. The rain can be quite heavy at times, so it is important to be prepared. However, on the other hand, the rainy season is also a great time to see the city's lush vegetation and beautiful flowers.
No matter when you decide to visit Nairobi, you are sure to have a wonderful time. The city is full of culture, history, and natural beauty. With its friendly people and delicious food, Nairobi is a great place to explore.
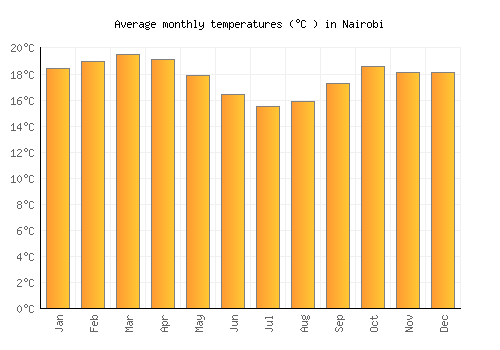
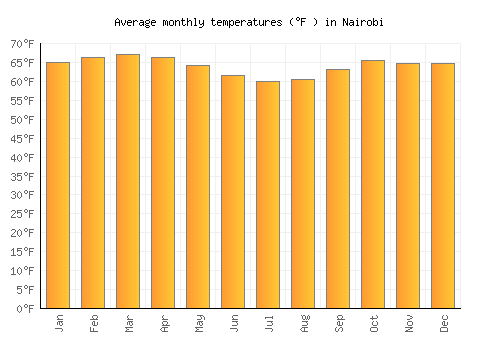
Average daytime temperature
The bar chart below shows the average monthly peak daytime temperatures at Nairobi
| Jan | Feb | Mar | Apr | May | Jun | Jul | Aug | Sep | Oct | Nov | Dec | |
|---|---|---|---|---|---|---|---|---|---|---|---|---|
| °C | 24.6 | 25.6 | 25.5 | 24 | 22.5 | 21.4 | 20.5 | 21.1 | 23.4 | 24.5 | 22.9 | 23.3 |
| °F | 76.3 | 78 | 77.8 | 75.1 | 72.4 | 70.4 | 68.9 | 70 | 74.2 | 76 | 73.2 | 74 |
Please note: these are the average peak daytime temperatures (usually around mid-afternoon) so do not show daytime / night highs and lows. To see the daily range of temperatures have a look at the temperature max / min chart below.
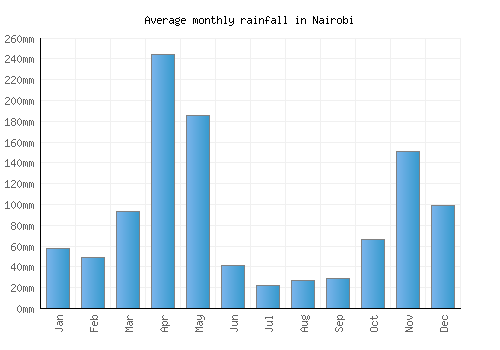
Average rainfall & rainy days
The graph below shows the average rainfall and number of rainy days per month.

| Jan | Feb | Mar | Apr | May | Jun | Jul | Aug | Sep | Oct | Nov | Dec | |
|---|---|---|---|---|---|---|---|---|---|---|---|---|
| mm | 58 | 49 | 93 | 244 | 186 | 42 | 22 | 27 | 29 | 67 | 151 | 99 |
| inches | 2.3 | 1.9 | 3.7 | 9.6 | 7.3 | 1.6 | 0.9 | 1.1 | 1.1 | 2.6 | 6 | 3.9 |
| Rainy days | 9 | 8 | 13 | 20 | 18 | 7 | 6 | 7 | 6 | 9 | 20 | 12 |
Average annual rainfall in Nairobi: 1101.8mm (433.8 inches)
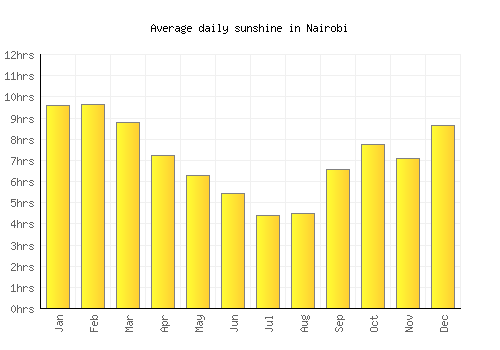
Average daily sunshine
The bar chart below shows the average daily sunshine hours in Nairobi
| Jan | Feb | Mar | Apr | May | Jun | Jul | Aug | Sep | Oct | Nov | Dec | |
|---|---|---|---|---|---|---|---|---|---|---|---|---|
| Hrs sunshine | 9.6 | 9.6 | 8.8 | 7.2 | 6.3 | 5.4 | 4.4 | 4.5 | 6.6 | 7.8 | 7.1 | 8.7 |
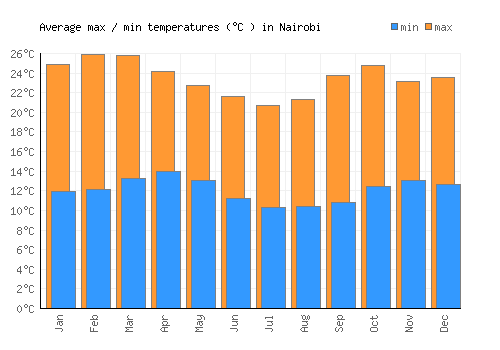
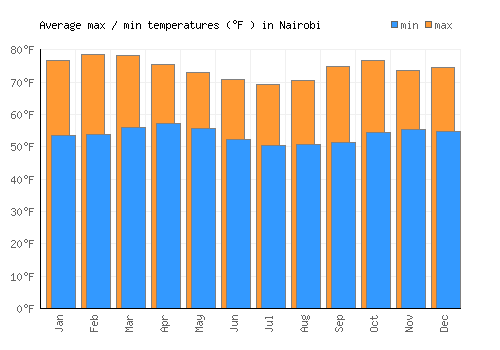
Day / night temperatures
The graph below shows the daily range of temperatures for each month.
| Jan | Feb | Mar | Apr | May | Jun | Jul | Aug | Sep | Oct | Nov | Dec | |
|---|---|---|---|---|---|---|---|---|---|---|---|---|
| Min °C | 11.9 | 12.1 | 13.3 | 14 | 13.1 | 11.2 | 10.3 | 10.5 | 10.9 | 12.5 | 13.1 | 12.6 |
| Max °C | 24.9 | 25.9 | 25.8 | 24.2 | 22.7 | 21.6 | 20.8 | 21.4 | 23.8 | 24.8 | 23.2 | 23.6 |
| Min °F | 53.4 | 53.8 | 55.9 | 57.2 | 55.6 | 52.2 | 50.5 | 50.8 | 51.5 | 54.4 | 55.5 | 54.7 |
| Max °F | 65.1 | 66.2 | 67.1 | 66.4 | 64.2 | 61.5 | 59.9 | 60.6 | 63.1 | 65.5 | 64.6 | 64.6 |
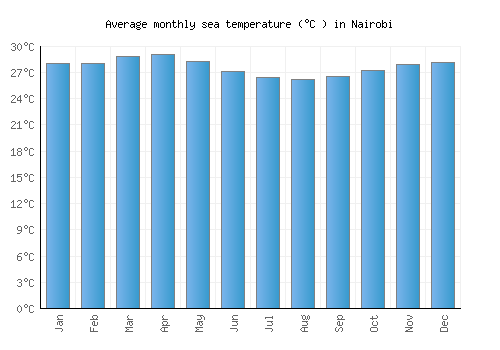
Sea temperature
The graph below shows the average sea temperature.
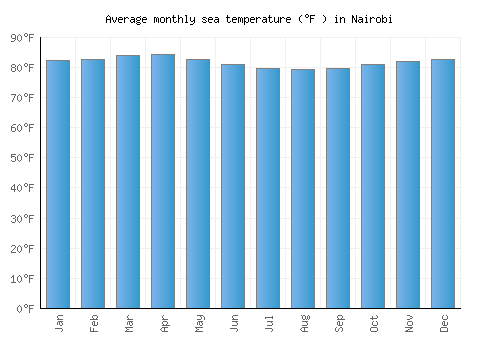
| Jan | Feb | Mar | Apr | May | Jun | Jul | Aug | Sep | Oct | Nov | Dec | |
|---|---|---|---|---|---|---|---|---|---|---|---|---|
| °C | 28 | 28.1 | 28.8 | 29 | 28.2 | 27.2 | 26.4 | 26.2 | 26.5 | 27.2 | 27.8 | 28.2 |
| °F | 82.4 | 82.5 | 83.9 | 84.3 | 82.8 | 80.9 | 79.5 | 79.2 | 79.7 | 80.9 | 82.1 | 82.7 |
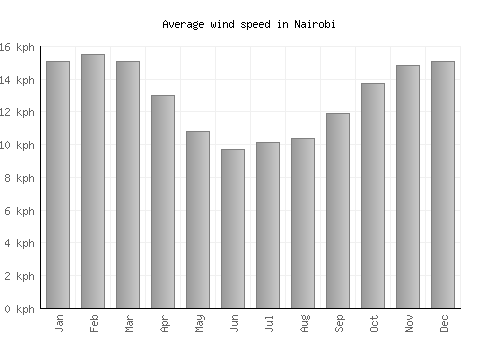
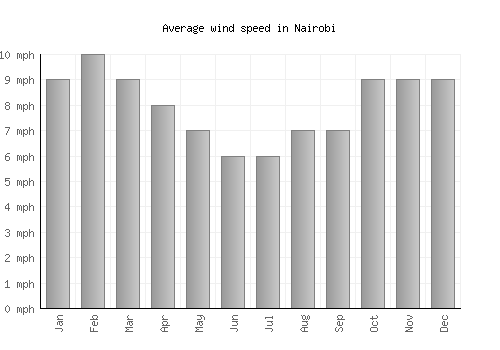
Wind speed
The graph below shows the average wind speed.
| Jan | Feb | Mar | Apr | May | Jun | Jul | Aug | Sep | Oct | Nov | Dec | |
|---|---|---|---|---|---|---|---|---|---|---|---|---|
| km/h | 15 | 16 | 15 | 13 | 11 | 10 | 10 | 10 | 12 | 14 | 15 | 15 |
| mph | 9 | 10 | 9 | 8 | 7 | 6 | 6 | 7 | 7 | 9 | 9 | 9 |
A monthly average windspeed of over 16km/h or 10mph suggests a location is fairly windy.
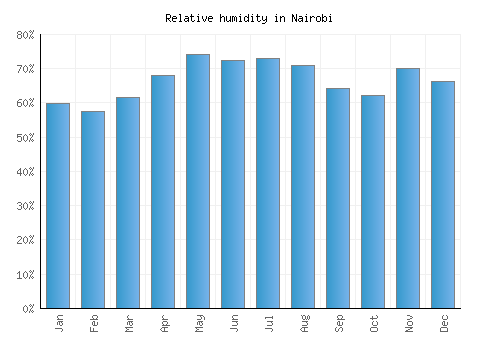
Relative humidity
The graph below shows the average relative humidity.
| Jan | Feb | Mar | Apr | May | Jun | Jul | Aug | Sep | Oct | Nov | Dec |
|---|---|---|---|---|---|---|---|---|---|---|---|
| 60% | 58% | 62% | 68% | 74% | 72% | 73% | 71% | 64% | 62% | 70% | 66% |

Other monthly averages
Nairobi weather stats
| Hottest month: | March | 25.5°C 77.9°F |
|---|---|---|
| Driest month: | July | 22mm 0.9ins |
| Sunniest month: | February | 9.6hrs |
| Coldest month: | July | 20.5°C 68.9°F |
| Wettest month: | April | 244mm 9.6ins |
| Warmest sea: | April | 29°C 84.2°F |