Marrakesh monthly weather averages
What's the weather like in Marrakesh?
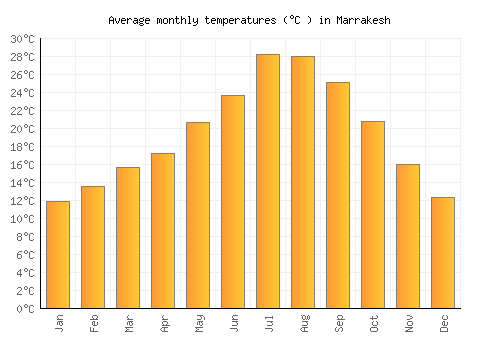
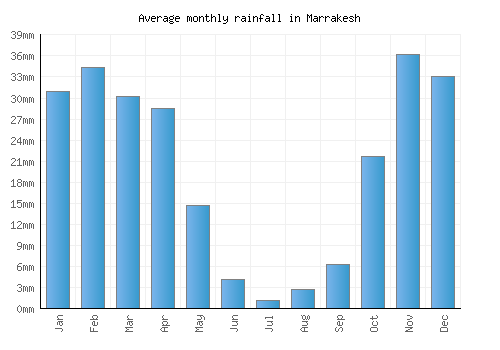
Marrakesh, located in the western part of Morocco, has a subtropical semi-arid climate with hot summers and mild winters. Temperatures generally remain warm throughout the year with an average of around 77°F (25°C). The hottest months are July and August when the mercury commonly hits over 95°F (35°C). Summers see very little rainfall, with most of the precipitation occurring in the winter months. January and February are the wettest months, with an average of 2.76 inches (70 mm) of rain.
The city is exposed to strong winds from the not too distant Atlantic coast, which cause welcome cooling in the summer months. This cooling effect can be felt most in the evenings, when temperatures drop to around 15°C (59°F). The city is also affected by the nearby Atlas Mountains, which can cause temperatures to drop by up to 10°C (18°F).
Marrakesh also experiences strong winds from the Sahara Desert, which can cause sand storms in the summer months. These storms often cause a haze to settle over the city, reducing visibility and creating conditions that can be uncomfortable for some.
Overall, Marrakesh has a very mild climate, with hot summers and mild winters. The city is exposed to strong winds, but these winds also provide cooling in the summer months. Rainfall is generally low, but the city does see some precipitation in the winter months.
Average daytime temperature
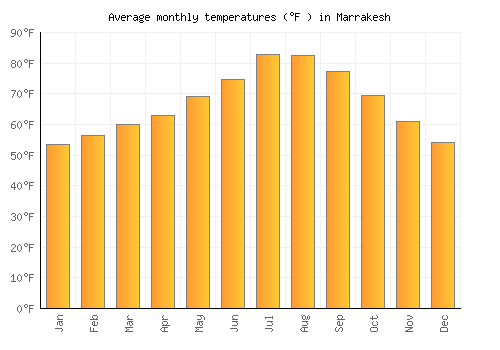
The bar chart below shows the average monthly peak daytime temperatures at Marrakesh
| Jan | Feb | Mar | Apr | May | Jun | Jul | Aug | Sep | Oct | Nov | Dec | |
|---|---|---|---|---|---|---|---|---|---|---|---|---|
| °C | 18 | 19.5 | 21.9 | 23.3 | 27.1 | 30.7 | 36.1 | 35.6 | 31.9 | 26.9 | 21.7 | 18.3 |
| °F | 64.4 | 67.1 | 71.4 | 74 | 80.8 | 87.3 | 96.9 | 96.1 | 89.4 | 80.5 | 71.1 | 64.9 |
Please note: these are the average peak daytime temperatures (usually around mid-afternoon) so do not show daytime / night highs and lows. To see the daily range of temperatures have a look at the temperature max / min chart below.
Average rainfall & rainy days
The graph below shows the average rainfall and number of rainy days per month.
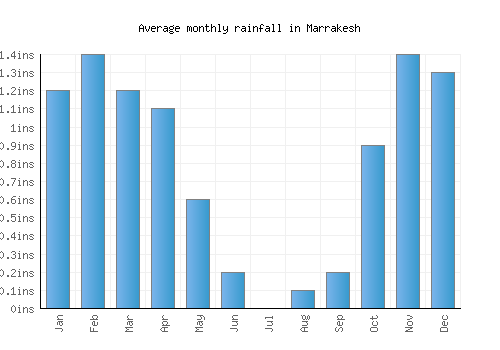
| Jan | Feb | Mar | Apr | May | Jun | Jul | Aug | Sep | Oct | Nov | Dec | |
|---|---|---|---|---|---|---|---|---|---|---|---|---|
| mm | 31 | 34 | 30 | 29 | 15 | 4 | 1 | 3 | 6 | 22 | 36 | 33 |
| inches | 1.2 | 1.4 | 1.2 | 1.1 | 0.6 | 0.2 | 0 | 0.1 | 0.2 | 0.9 | 1.4 | 1.3 |
| Rainy days | 6 | 6 | 6 | 6 | 4 | 1 | 1 | 1 | 3 | 4 | 6 | 5 |
Average annual rainfall in Marrakesh: 267.666mm (105.4 inches)
Average daily sunshine
The bar chart below shows the average daily sunshine hours in Marrakesh
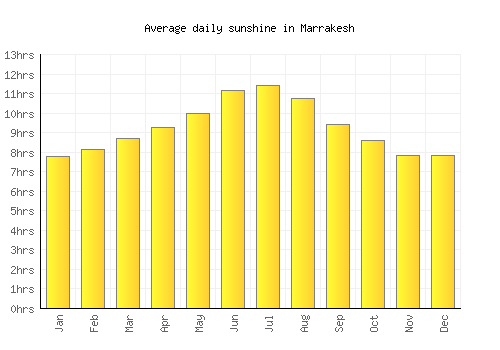
| Jan | Feb | Mar | Apr | May | Jun | Jul | Aug | Sep | Oct | Nov | Dec | |
|---|---|---|---|---|---|---|---|---|---|---|---|---|
| Hrs sunshine | 7.8 | 8.1 | 8.7 | 9.3 | 10 | 11.2 | 11.4 | 10.8 | 9.4 | 8.6 | 7.8 | 7.8 |
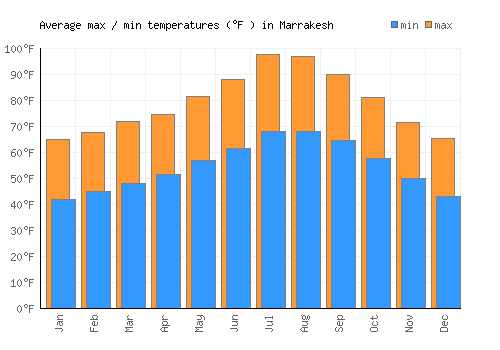
Day / night temperatures
The graph below shows the daily range of temperatures for each month.
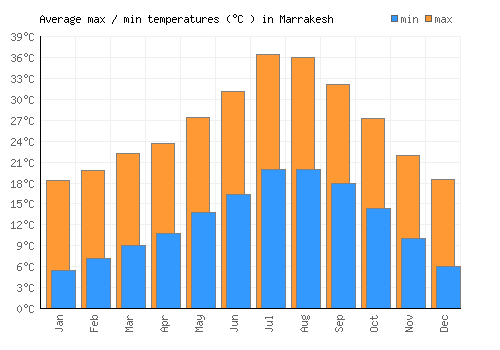
| Jan | Feb | Mar | Apr | May | Jun | Jul | Aug | Sep | Oct | Nov | Dec | |
|---|---|---|---|---|---|---|---|---|---|---|---|---|
| Min °C | 5.5 | 7.2 | 9 | 10.8 | 13.8 | 16.3 | 20 | 20 | 18 | 14.4 | 10 | 6.1 |
| Max °C | 18.3 | 19.8 | 22.2 | 23.7 | 27.5 | 31.1 | 36.5 | 36 | 32.2 | 27.3 | 22 | 18.6 |
| Min °F | 41.9 | 45 | 48.2 | 51.4 | 56.8 | 61.3 | 67.9 | 68 | 64.4 | 57.8 | 50 | 42.9 |
| Max °F | 53.4 | 56.3 | 60.1 | 63 | 69.1 | 74.7 | 82.8 | 82.4 | 77.2 | 69.4 | 60.8 | 54.1 |
Sea temperature
The graph below shows the average sea temperature.
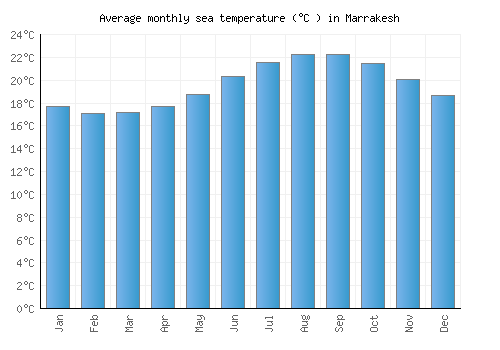
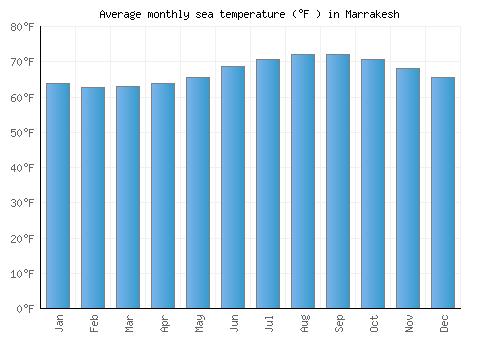
| Jan | Feb | Mar | Apr | May | Jun | Jul | Aug | Sep | Oct | Nov | Dec | |
|---|---|---|---|---|---|---|---|---|---|---|---|---|
| °C | 17.7 | 17.1 | 17.2 | 17.7 | 18.7 | 20.3 | 21.6 | 22.3 | 22.2 | 21.5 | 20.1 | 18.7 |
| °F | 63.8 | 62.8 | 62.9 | 63.9 | 65.7 | 68.6 | 70.8 | 72.1 | 72 | 70.6 | 68.1 | 65.6 |
Wind speed
The graph below shows the average wind speed.
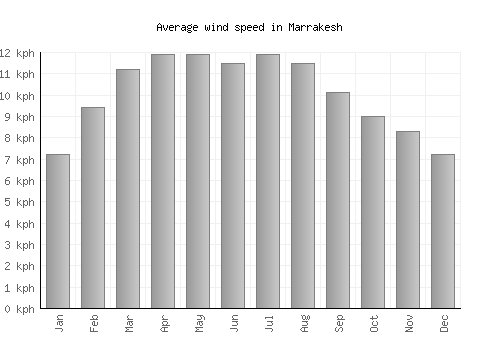
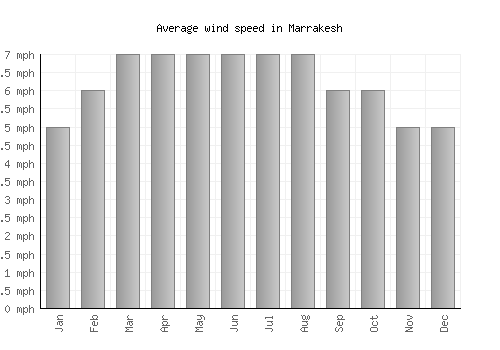
| Jan | Feb | Mar | Apr | May | Jun | Jul | Aug | Sep | Oct | Nov | Dec | |
|---|---|---|---|---|---|---|---|---|---|---|---|---|
| km/h | 7 | 9 | 11 | 12 | 12 | 12 | 12 | 12 | 10 | 9 | 8 | 7 |
| mph | 5 | 6 | 7 | 7 | 7 | 7 | 7 | 7 | 6 | 6 | 5 | 5 |
A monthly average windspeed of over 16km/h or 10mph suggests a location is fairly windy.
Relative humidity
The graph below shows the average relative humidity.
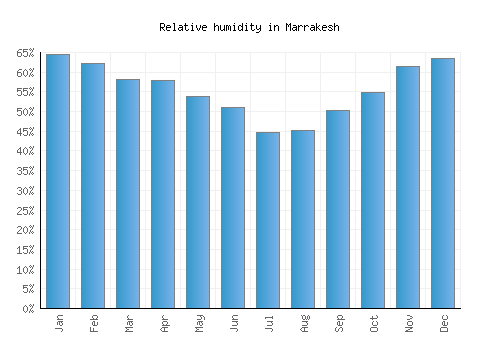
| Jan | Feb | Mar | Apr | May | Jun | Jul | Aug | Sep | Oct | Nov | Dec |
|---|---|---|---|---|---|---|---|---|---|---|---|
| 65% | 62% | 58% | 58% | 54% | 51% | 45% | 45% | 50% | 55% | 62% | 64% |

Other monthly averages
Marrakesh weather stats
| Hottest month: | July | 36.1°C 97°F |
|---|---|---|
| Driest month: | July | 1mm 0ins |
| Sunniest month: | July | 11.4hrs |
| Coldest month: | January | 18°C 64.4°F |
| Wettest month: | November | 36mm 1.4ins |
| Warmest sea: | August | 22.3°C 72.1°F |