Cape Town monthly weather averages
What's the weather like in Cape Town?
Cape Town is a coastal city located in the Western Cape Province of South Africa. As such it has a semi-arid climate, meaning it experiences hot, dry summers and mild, wet winters. The average temperature in summer is around 25°C (77°F), while winter temperatures rarely drop below 10°C (50°F).
Cape Town is located in a rain shadow formed by the mountains surrounding it, which means it has lower rainfall than other cities in the region. The city has an average yearly rainfall of not much over 500 mm (20 inches), which is fairly low compared to other coastal cities in South Africa.
Cape Town is prone to strong winds, especially during the summer months. The south-easterly wind, known as the ‘Cape Doctor’, is a strong and reliable wind that can reach speeds of up to 120 km/h (75 mph). This wind brings in moisture from the sea and helps to cool down the city - the 'table-cloth' effect.
Overall, Cape Town has a pleasant climate that makes it a great place to visit year-round. The mild temperatures and low rainfall make it an ideal holiday destination for those wanting to escape the heat of the summer months, as long as you don't mind a breeze.
Average daytime temperature
The bar chart below shows the average monthly peak daytime temperatures at Cape Town
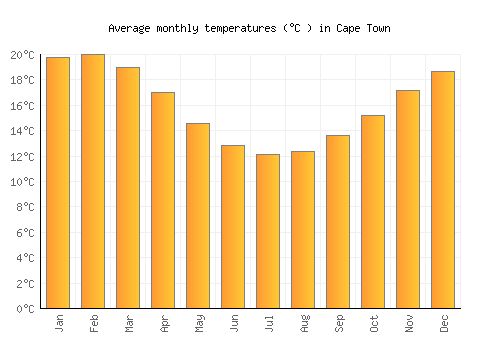
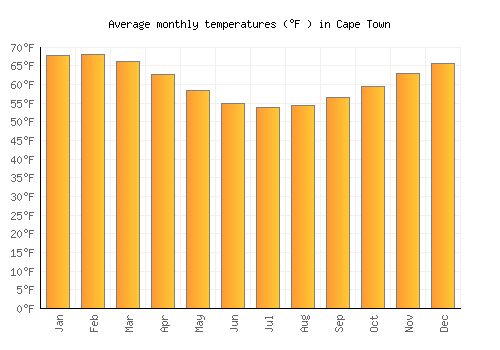
| Jan | Feb | Mar | Apr | May | Jun | Jul | Aug | Sep | Oct | Nov | Dec | |
|---|---|---|---|---|---|---|---|---|---|---|---|---|
| °C | 24.5 | 24.8 | 23.8 | 21.7 | 19 | 16.9 | 16.2 | 16.5 | 17.9 | 19.8 | 21.8 | 23.3 |
| °F | 76 | 76.7 | 74.9 | 71 | 66.2 | 62.4 | 61.2 | 61.8 | 64.2 | 67.6 | 71.2 | 73.9 |
Please note: these are the average peak daytime temperatures (usually around mid-afternoon) so do not show daytime / night highs and lows. To see the daily range of temperatures have a look at the temperature max / min chart below.
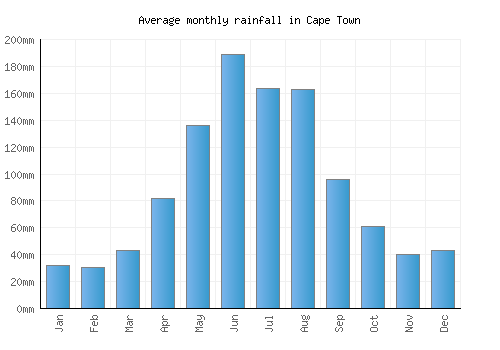
Average rainfall & rainy days
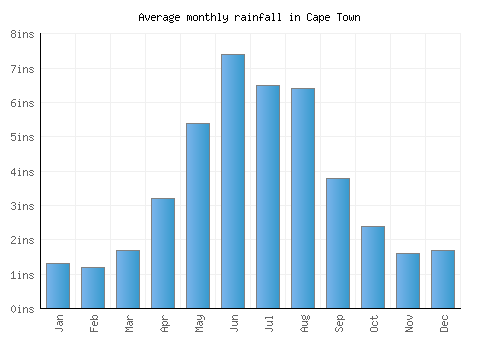
The graph below shows the average rainfall and number of rainy days per month.
| Jan | Feb | Mar | Apr | May | Jun | Jul | Aug | Sep | Oct | Nov | Dec | |
|---|---|---|---|---|---|---|---|---|---|---|---|---|
| mm | 32 | 31 | 43 | 82 | 136 | 189 | 164 | 163 | 96 | 61 | 40 | 43 |
| inches | 1.3 | 1.2 | 1.7 | 3.2 | 5.4 | 7.4 | 6.5 | 6.4 | 3.8 | 2.4 | 1.6 | 1.7 |
| Rainy days | 5 | 4 | 5 | 8 | 12 | 13 | 13 | 14 | 11 | 9 | 6 | 6 |
Average annual rainfall in Cape Town: 1063.8mm (418.8 inches)
Average daily sunshine
The bar chart below shows the average daily sunshine hours in Cape Town

| Jan | Feb | Mar | Apr | May | Jun | Jul | Aug | Sep | Oct | Nov | Dec | |
|---|---|---|---|---|---|---|---|---|---|---|---|---|
| Hrs sunshine | 11.6 | 11 | 9.8 | 8 | 6.7 | 5.9 | 6.4 | 7 | 7.8 | 9.2 | 10.6 | 11.3 |
Day / night temperatures
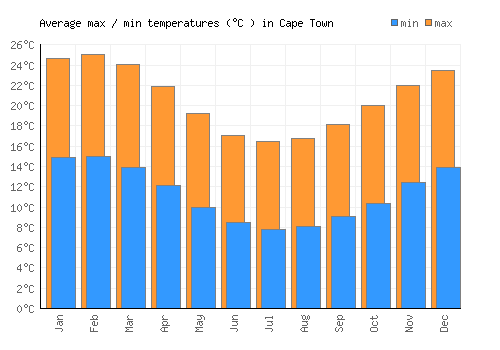
The graph below shows the daily range of temperatures for each month.

| Jan | Feb | Mar | Apr | May | Jun | Jul | Aug | Sep | Oct | Nov | Dec | |
|---|---|---|---|---|---|---|---|---|---|---|---|---|
| Min °C | 14.9 | 15 | 14 | 12.1 | 10 | 8.5 | 7.8 | 8.1 | 9.1 | 10.4 | 12.4 | 13.9 |
| Max °C | 24.7 | 25.1 | 24.1 | 21.9 | 19.2 | 17.1 | 16.5 | 16.8 | 18.1 | 20 | 22 | 23.5 |
| Min °F | 58.8 | 58.9 | 57.1 | 53.8 | 50 | 47.3 | 46 | 46.5 | 48.4 | 50.7 | 54.3 | 57 |
| Max °F | 67.6 | 68 | 66.2 | 62.6 | 58.3 | 55 | 53.8 | 54.3 | 56.5 | 59.4 | 63 | 65.7 |
Sea temperature
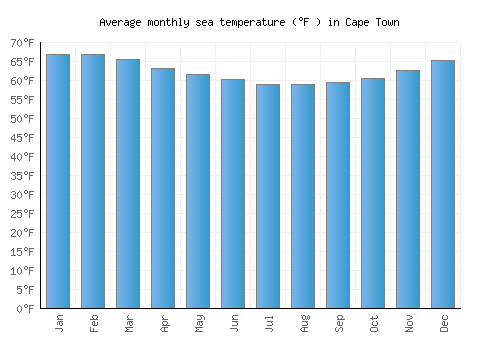
The graph below shows the average sea temperature.

| Jan | Feb | Mar | Apr | May | Jun | Jul | Aug | Sep | Oct | Nov | Dec | |
|---|---|---|---|---|---|---|---|---|---|---|---|---|
| °C | 19.3 | 19.4 | 18.7 | 17.4 | 16.4 | 15.7 | 15 | 15 | 15.3 | 15.9 | 17 | 18.5 |
| °F | 66.8 | 66.9 | 65.6 | 63.2 | 61.6 | 60.2 | 59.1 | 58.9 | 59.6 | 60.5 | 62.6 | 65.4 |
Wind speed
The graph below shows the average wind speed.


| Jan | Feb | Mar | Apr | May | Jun | Jul | Aug | Sep | Oct | Nov | Dec | |
|---|---|---|---|---|---|---|---|---|---|---|---|---|
| km/h | 22 | 21 | 18 | 15 | 14 | 14 | 15 | 16 | 17 | 19 | 22 | 22 |
| mph | 14 | 13 | 11 | 9 | 9 | 9 | 9 | 10 | 11 | 12 | 14 | 14 |
A monthly average windspeed of over 16km/h or 10mph suggests a location is fairly windy.
Relative humidity
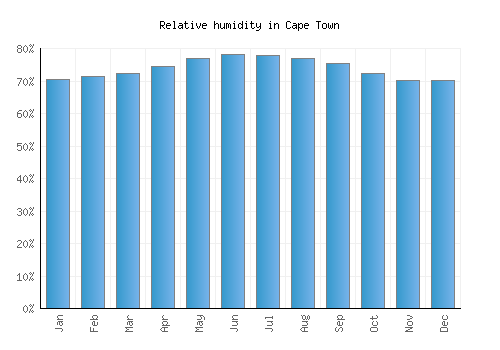
The graph below shows the average relative humidity.
| Jan | Feb | Mar | Apr | May | Jun | Jul | Aug | Sep | Oct | Nov | Dec |
|---|---|---|---|---|---|---|---|---|---|---|---|
| 71% | 71% | 72% | 74% | 77% | 78% | 78% | 77% | 75% | 73% | 70% | 70% |

Other monthly averages
Cape Town weather stats
| Hottest month: | February | 24.8°C 76.6°F |
|---|---|---|
| Driest month: | February | 31mm 1.2ins |
| Sunniest month: | February | 11hrs |
| Coldest month: | July | 16.2°C 61.2°F |
| Wettest month: | June | 189mm 7.4ins |
| Warmest sea: | February | 19.4°C 66.9°F |