Hong Kong monthly weather averages
What's the weather like in Hong Kong?
Hong Kong has a humid subtropical climate, with hot and humid summers and mild, dry winters. The climate is dominated by the East Asian monsoon, resulting in moderate seasonal temperature variations.
The coolest month is January, with an average temperature of around 18° C (65° F), while the hottest is July, with an average temperature of 31° C (88° F). Summer is the wettest season, with an average of about 350 mm (14 inches) of rainfall per month. Winter is the driest season, with an average of about 30 mm (1 inch) of rainfall per month.
The climate is generally mild and sunny, with an average of 2,800 hours of sunshine per year. Hong Kong city is located in a typhoon-prone area, with an average of three to four typhoons occurring each year, typically between May and October.
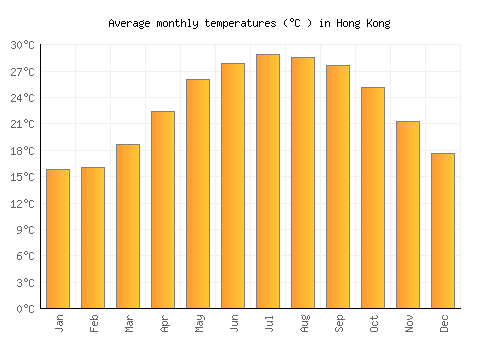
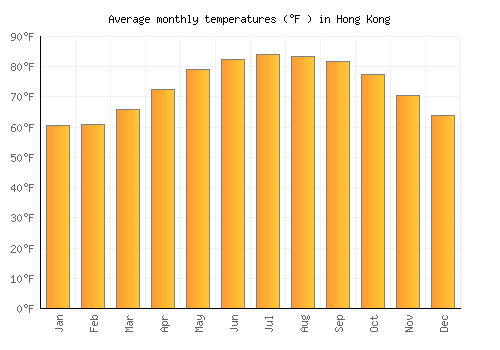
Average daytime temperature
The bar chart below shows the average monthly peak daytime temperatures at Hong Kong
| Jan | Feb | Mar | Apr | May | Jun | Jul | Aug | Sep | Oct | Nov | Dec | |
|---|---|---|---|---|---|---|---|---|---|---|---|---|
| °C | 18.4 | 18.3 | 21.1 | 24.7 | 28.4 | 30 | 31.3 | 31 | 30 | 27.6 | 23.8 | 20.2 |
| °F | 65.1 | 65 | 69.9 | 76.5 | 83.2 | 86.1 | 88.3 | 87.9 | 86 | 81.6 | 74.8 | 68.4 |
Please note: these are the average peak daytime temperatures (usually around mid-afternoon) so do not show daytime / night highs and lows. To see the daily range of temperatures have a look at the temperature max / min chart below.
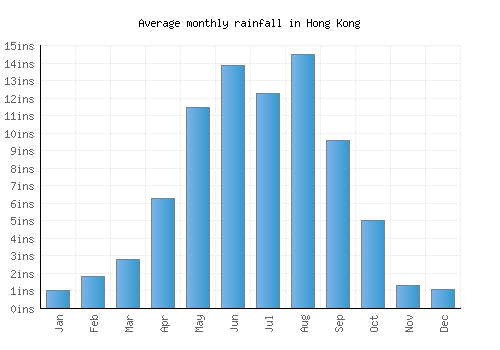
Average rainfall & rainy days
The graph below shows the average rainfall and number of rainy days per month.

| Jan | Feb | Mar | Apr | May | Jun | Jul | Aug | Sep | Oct | Nov | Dec | |
|---|---|---|---|---|---|---|---|---|---|---|---|---|
| mm | 25 | 45 | 70 | 159 | 292 | 354 | 312 | 368 | 245 | 128 | 34 | 27 |
| inches | 1 | 1.8 | 2.8 | 6.3 | 11.5 | 13.9 | 12.3 | 14.5 | 9.6 | 5 | 1.3 | 1.1 |
| Rainy days | 6 | 9 | 10 | 11 | 15 | 19 | 17 | 17 | 15 | 8 | 6 | 4 |
Average annual rainfall in Hong Kong: 2195.233mm (864.3 inches)
Average daily sunshine
The bar chart below shows the average daily sunshine hours in Hong Kong
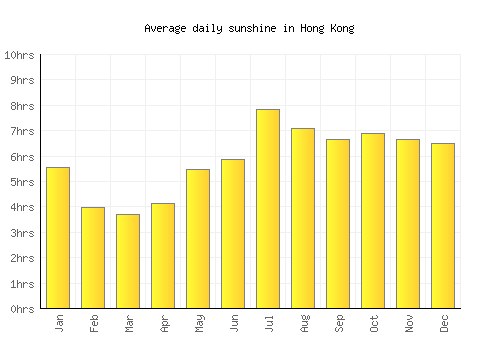
| Jan | Feb | Mar | Apr | May | Jun | Jul | Aug | Sep | Oct | Nov | Dec | |
|---|---|---|---|---|---|---|---|---|---|---|---|---|
| Hrs sunshine | 5.6 | 4 | 3.7 | 4.1 | 5.5 | 5.9 | 7.8 | 7.1 | 6.7 | 6.9 | 6.7 | 6.5 |
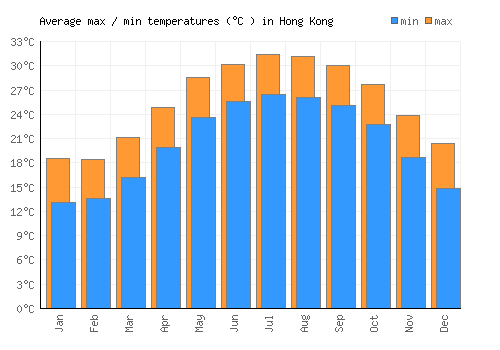
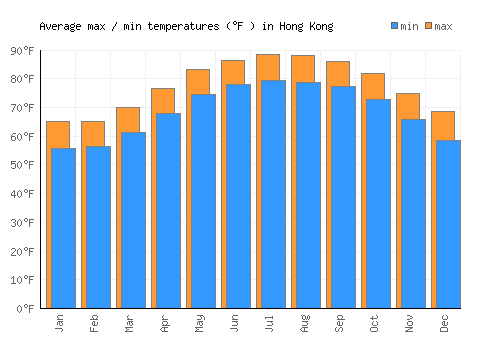
Day / night temperatures
The graph below shows the daily range of temperatures for each month.
| Jan | Feb | Mar | Apr | May | Jun | Jul | Aug | Sep | Oct | Nov | Dec | |
|---|---|---|---|---|---|---|---|---|---|---|---|---|
| Min °C | 13.1 | 13.6 | 16.2 | 20 | 23.7 | 25.7 | 26.4 | 26.1 | 25.1 | 22.7 | 18.7 | 14.9 |
| Max °C | 18.5 | 18.5 | 21.2 | 24.9 | 28.6 | 30.2 | 31.4 | 31.2 | 30.1 | 27.7 | 23.9 | 20.4 |
| Min °F | 55.6 | 56.4 | 61.2 | 67.9 | 74.6 | 78.2 | 79.5 | 78.9 | 77.2 | 72.9 | 65.7 | 58.7 |
| Max °F | 60.4 | 60.8 | 65.7 | 72.3 | 79 | 82.2 | 84 | 83.5 | 81.7 | 77.4 | 70.3 | 63.7 |
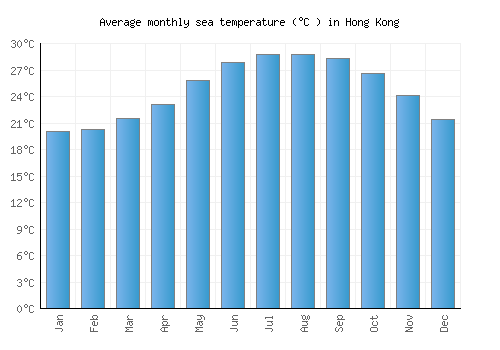
Sea temperature
The graph below shows the average sea temperature.
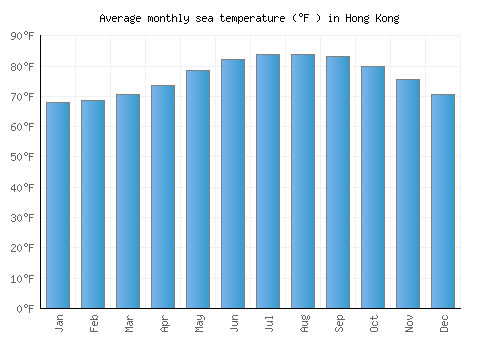
| Jan | Feb | Mar | Apr | May | Jun | Jul | Aug | Sep | Oct | Nov | Dec | |
|---|---|---|---|---|---|---|---|---|---|---|---|---|
| °C | 20.1 | 20.3 | 21.5 | 23.1 | 25.9 | 27.9 | 28.8 | 28.8 | 28.4 | 26.6 | 24.1 | 21.4 |
| °F | 68.1 | 68.6 | 70.7 | 73.6 | 78.6 | 82.2 | 83.8 | 83.8 | 83 | 80 | 75.5 | 70.5 |
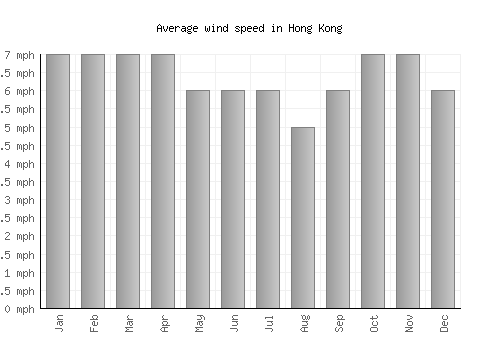
Wind speed
The graph below shows the average wind speed.
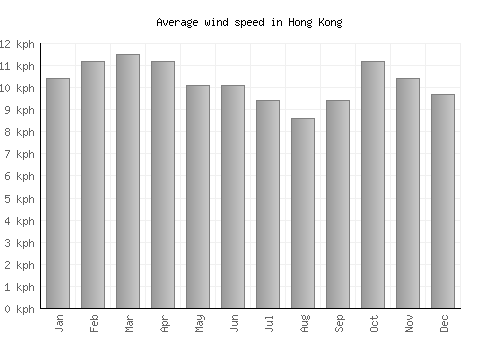
| Jan | Feb | Mar | Apr | May | Jun | Jul | Aug | Sep | Oct | Nov | Dec | |
|---|---|---|---|---|---|---|---|---|---|---|---|---|
| km/h | 10 | 11 | 12 | 11 | 10 | 10 | 9 | 9 | 9 | 11 | 10 | 10 |
| mph | 7 | 7 | 7 | 7 | 6 | 6 | 6 | 5 | 6 | 7 | 7 | 6 |
A monthly average windspeed of over 16km/h or 10mph suggests a location is fairly windy.
Relative humidity
The graph below shows the average relative humidity.
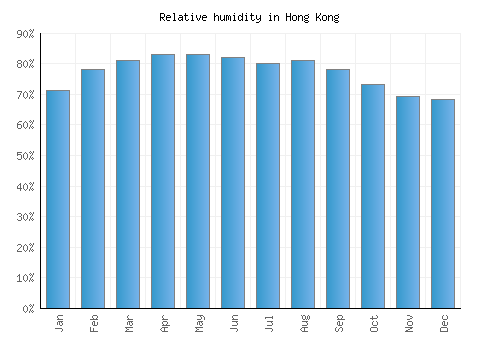
| Jan | Feb | Mar | Apr | May | Jun | Jul | Aug | Sep | Oct | Nov | Dec |
|---|---|---|---|---|---|---|---|---|---|---|---|
| 71% | 78% | 81% | 83% | 83% | 82% | 80% | 81% | 78% | 73% | 69% | 68% |
Other monthly averages
Hong Kong weather stats
| Hottest month: | July | 31.3°C 88.3°F |
|---|---|---|
| Driest month: | January | 25mm 1ins |
| Sunniest month: | November | 6.7hrs |
| Coldest month: | January | 18.4°C 65.1°F |
| Wettest month: | August | 368mm 14.5ins |
| Warmest sea: | August | 28.8°C 83.8°F |