Mumbai monthly weather averages
What's the weather like in Mumbai?
Mumbai has a tropical climate, with hot, humid summers and warm, dry winters. The city experiences a monsoon season, typically lasting from June to September. During this time, the city experiences heavy rainfall and storms, with temperatures averaging between 27 and 33 degrees Celsius (80-90 degrees Farenheit). In the winter months, temperatures in Mumbai usually range between 17 and 28 degrees Celsius (65-80 degrees Farenheit), and the city is relatively dry.
Mumbai receives an average of 2,000 millimeters (79 inches) of rain per year. The monsoon season brings the most rain and Mumbai can receive up to 300 millimeters (12 inches) of rain per month during this period.
The humidity in Mumbai is high year-round. The average humidity is 78%. The humidity is highest during the monsoon season, when it can reach 90%.
Mumbai can also experience fairly extreme temperatures during the summer months, ranging from 35 to 42 degrees Celsius (95-108 °F). In addition, Mumbai has realatively high levels of air pollution, with its hectic traffic and industrial activity.
The best time to visit Mumbai is during the winter, from December to February. The weather is warm and dry, and the humidity is lower. The monsoon season is also a popular time to visit, as the city comes alive with color and activity. However, it is important to be prepared for the heavy rains.
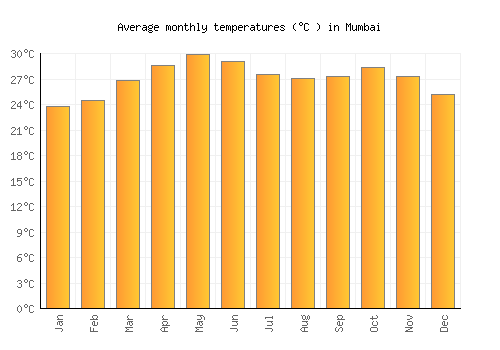
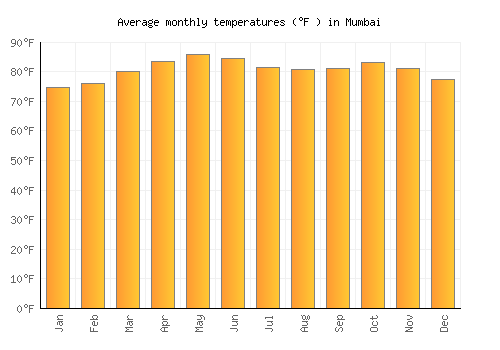
Average daytime temperature
The bar chart below shows the average monthly peak daytime temperatures at Mumbai
| Jan | Feb | Mar | Apr | May | Jun | Jul | Aug | Sep | Oct | Nov | Dec | |
|---|---|---|---|---|---|---|---|---|---|---|---|---|
| °C | 30.2 | 30.8 | 32.3 | 33.1 | 33.4 | 32.1 | 29.9 | 29.5 | 30.2 | 33 | 33 | 31.3 |
| °F | 86.4 | 87.4 | 90.2 | 91.5 | 92.2 | 89.8 | 85.9 | 85.1 | 86.4 | 91.3 | 91.4 | 88.4 |
Please note: these are the average peak daytime temperatures (usually around mid-afternoon) so do not show daytime / night highs and lows. To see the daily range of temperatures have a look at the temperature max / min chart below.
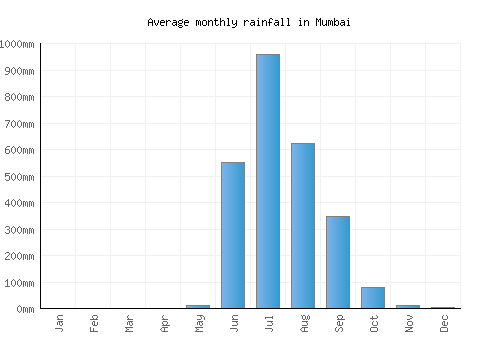
Average rainfall & rainy days
The graph below shows the average rainfall and number of rainy days per month.

| Jan | Feb | Mar | Apr | May | Jun | Jul | Aug | Sep | Oct | Nov | Dec | |
|---|---|---|---|---|---|---|---|---|---|---|---|---|
| mm | 1 | 1 | 0 | 1 | 12 | 551 | 959 | 623 | 346 | 79 | 10 | 3 |
| inches | 0 | 0 | 0 | 0 | 0.5 | 21.7 | 37.8 | 24.5 | 13.6 | 3.1 | 0.4 | 0.1 |
| Rainy days | 0 | 0 | 0 | 0 | 1 | 14 | 22 | 21 | 13 | 3 | 1 | 0 |
Average annual rainfall in Mumbai: 2676.9mm (1053.9 inches)
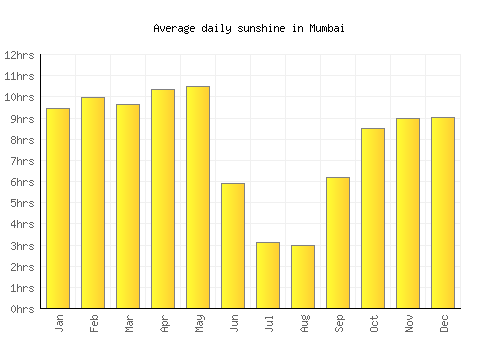
Average daily sunshine
The bar chart below shows the average daily sunshine hours in Mumbai
| Jan | Feb | Mar | Apr | May | Jun | Jul | Aug | Sep | Oct | Nov | Dec | |
|---|---|---|---|---|---|---|---|---|---|---|---|---|
| Hrs sunshine | 9.4 | 10 | 9.6 | 10.3 | 10.5 | 5.9 | 3.1 | 3 | 6.2 | 8.5 | 9 | 9 |
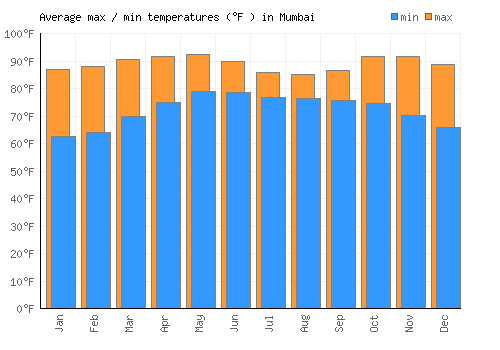
Day / night temperatures
The graph below shows the daily range of temperatures for each month.
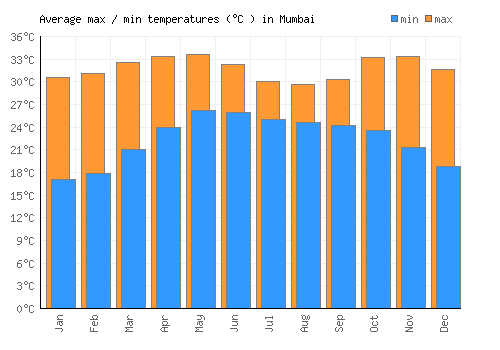
| Jan | Feb | Mar | Apr | May | Jun | Jul | Aug | Sep | Oct | Nov | Dec | |
|---|---|---|---|---|---|---|---|---|---|---|---|---|
| Min °C | 17.1 | 17.9 | 21 | 23.9 | 26.2 | 26 | 25 | 24.6 | 24.3 | 23.6 | 21.3 | 18.8 |
| Max °C | 30.6 | 31.1 | 32.6 | 33.3 | 33.6 | 32.3 | 30.1 | 29.6 | 30.4 | 33.2 | 33.3 | 31.7 |
| Min °F | 62.7 | 64.2 | 69.8 | 75 | 79.2 | 78.7 | 76.9 | 76.3 | 75.7 | 74.5 | 70.3 | 65.8 |
| Max °F | 74.8 | 76.1 | 80.2 | 83.5 | 85.8 | 84.4 | 81.5 | 80.8 | 81.1 | 83.1 | 81.1 | 77.4 |
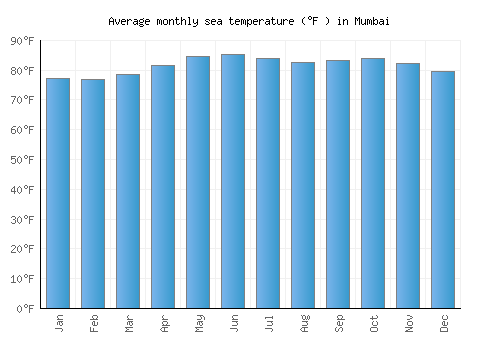
Sea temperature
The graph below shows the average sea temperature.
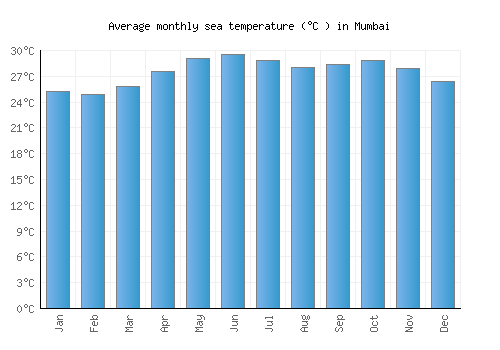
| Jan | Feb | Mar | Apr | May | Jun | Jul | Aug | Sep | Oct | Nov | Dec | |
|---|---|---|---|---|---|---|---|---|---|---|---|---|
| °C | 25.2 | 24.9 | 25.9 | 27.5 | 29.1 | 29.5 | 28.8 | 28 | 28.4 | 28.8 | 27.9 | 26.4 |
| °F | 77.3 | 76.8 | 78.6 | 81.6 | 84.4 | 85.2 | 83.9 | 82.4 | 83.1 | 83.9 | 82.2 | 79.6 |
Wind speed
The graph below shows the average wind speed.
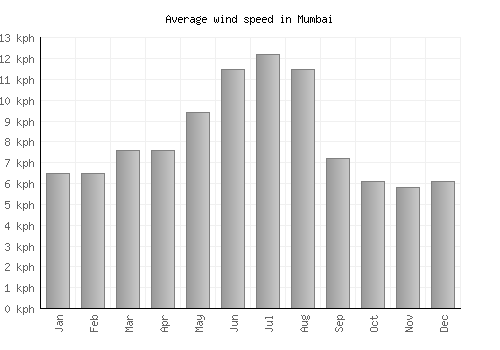
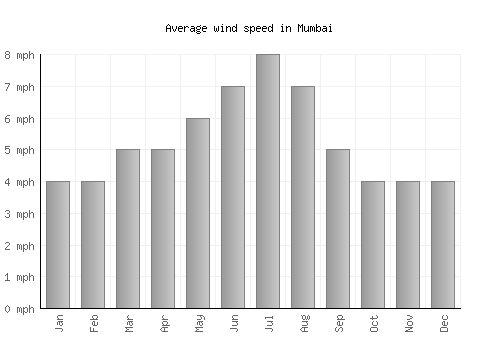
| Jan | Feb | Mar | Apr | May | Jun | Jul | Aug | Sep | Oct | Nov | Dec | |
|---|---|---|---|---|---|---|---|---|---|---|---|---|
| km/h | 7 | 7 | 8 | 8 | 9 | 12 | 12 | 12 | 7 | 6 | 6 | 6 |
| mph | 4 | 4 | 5 | 5 | 6 | 7 | 8 | 7 | 5 | 4 | 4 | 4 |
A monthly average windspeed of over 16km/h or 10mph suggests a location is fairly windy.
Relative humidity
The graph below shows the average relative humidity.
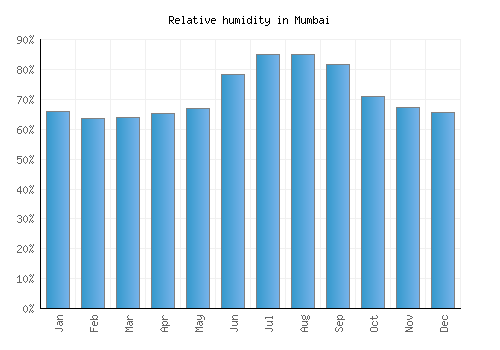
| Jan | Feb | Mar | Apr | May | Jun | Jul | Aug | Sep | Oct | Nov | Dec |
|---|---|---|---|---|---|---|---|---|---|---|---|
| 66% | 64% | 64% | 66% | 67% | 78% | 85% | 85% | 82% | 71% | 68% | 66% |

Other monthly averages
Mumbai weather stats
| Hottest month: | May | 33.4°C 92.1°F |
|---|---|---|
| Driest month: | March | 0mm 0ins |
| Sunniest month: | February | 10hrs |
| Coldest month: | January | 30.2°C 86.4°F |
| Wettest month: | July | 959mm 37.8ins |
| Warmest sea: | June | 29.5°C 85.1°F |

Top India locations
- Āgra
- Amritsar
- Bangalore
- Bhopāl
- Bodhgaya
- Calangute
- Chennai
- Hyderābād
- Jaipur
- Kochi
- Kolkata
- Manāli
- Mumbai
- Mysore
- New Delhi
- Pune
- Shimla