Singapore monthly weather averages
What's the weather like in Singapore?
Singapore has a tropical climate with high temperatures and humidity throughout the year. Average temperatures range from 24 to 32 °C (75 to 90 °F). Rainfall is common all year round, but the amount varies from month to month. The yearly average is 2,340 mm (92 in) of rain annually and the wettest months are from November to January when the north-east monsoon brings heavy showers every day. The driest months are from June to August.
The climate of Singapore is influenced by its location near the equator and its proximity to the sea. The equator receives direct sunlight all year round, which makes the weather hot and humid. The sea helps to moderate the temperature, but it also contributes to the high humidity. The city-state is also typically experiences two monsoon seasons. The Northeast monsoon season lasts from December to early March, while the Southwest monsoon season typically lasts from June to September.
Singapore is also prone to tropical storms and typhoons, which usually occur between April and October. These storms are usually accompanied by heavy rainfall and strong winds, so it is best to stay indoors during such storms.
Singapore has a reputation for being one of the cleanest and greenest cities in the world. The government has implemented strict environmental regulations and initiatives and has made great strides in reducing air and water pollution. The best time to visit Singapore is during the dry season, when the weather is cooler and more comfortable.
Average daytime temperature
The bar chart below shows the average monthly peak daytime temperatures at Singapore
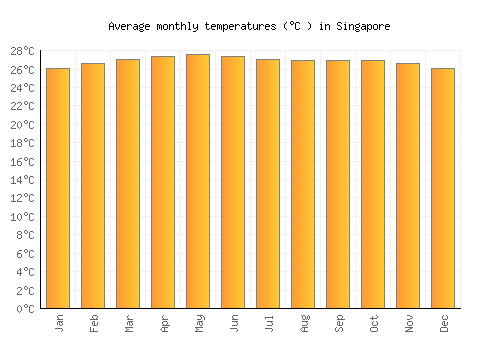
| Jan | Feb | Mar | Apr | May | Jun | Jul | Aug | Sep | Oct | Nov | Dec | |
|---|---|---|---|---|---|---|---|---|---|---|---|---|
| °C | 29.5 | 30.3 | 30.8 | 31 | 31.1 | 30.8 | 30.5 | 30.4 | 30.4 | 30.7 | 30.2 | 29.4 |
| °F | 85.2 | 86.5 | 87.4 | 87.8 | 87.9 | 87.4 | 86.9 | 86.7 | 86.8 | 87.2 | 86.3 | 84.9 |
Please note: these are the average peak daytime temperatures (usually around mid-afternoon) so do not show daytime / night highs and lows. To see the daily range of temperatures have a look at the temperature max / min chart below.
Average rainfall & rainy days
The graph below shows the average rainfall and number of rainy days per month.
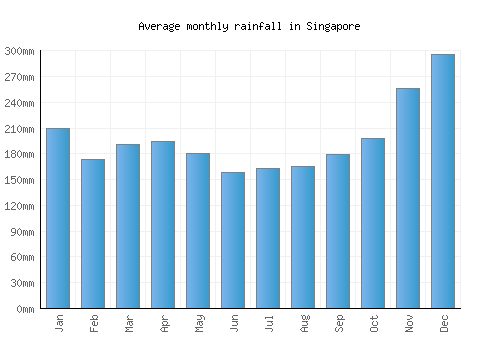

| Jan | Feb | Mar | Apr | May | Jun | Jul | Aug | Sep | Oct | Nov | Dec | |
|---|---|---|---|---|---|---|---|---|---|---|---|---|
| mm | 209 | 173 | 191 | 195 | 180 | 159 | 163 | 165 | 179 | 197 | 256 | 296 |
| inches | 8.2 | 6.8 | 7.5 | 7.7 | 7.1 | 6.3 | 6.4 | 6.5 | 7.1 | 7.8 | 10.1 | 11.6 |
| Rainy days | 13 | 10 | 13 | 14 | 14 | 13 | 14 | 13 | 14 | 16 | 20 | 20 |
Average annual rainfall in Singapore: 2469.4445mm (972.2 inches)
Average daily sunshine
The bar chart below shows the average daily sunshine hours in Singapore
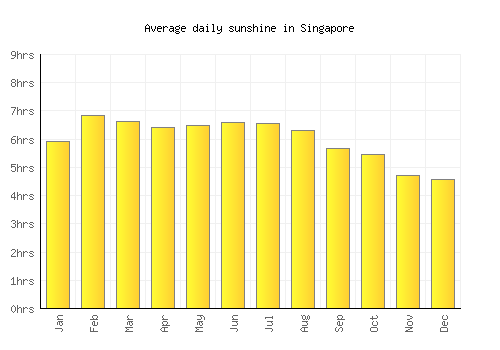
| Jan | Feb | Mar | Apr | May | Jun | Jul | Aug | Sep | Oct | Nov | Dec | |
|---|---|---|---|---|---|---|---|---|---|---|---|---|
| Hrs sunshine | 5.9 | 6.8 | 6.6 | 6.4 | 6.5 | 6.6 | 6.6 | 6.3 | 5.7 | 5.5 | 4.7 | 4.6 |
Day / night temperatures
The graph below shows the daily range of temperatures for each month.
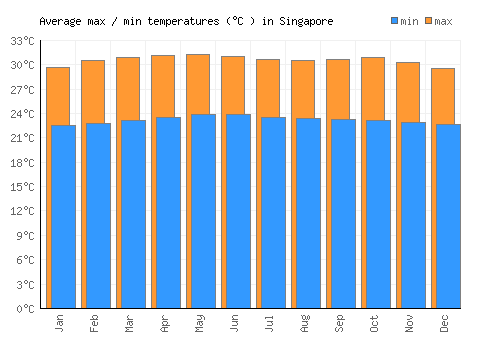
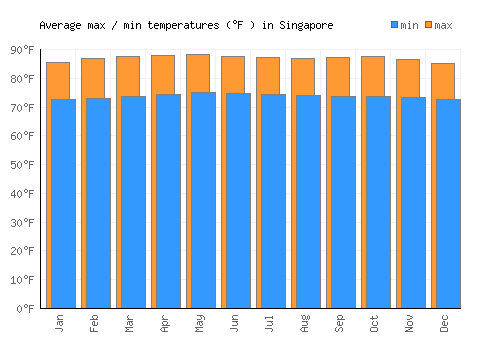
| Jan | Feb | Mar | Apr | May | Jun | Jul | Aug | Sep | Oct | Nov | Dec | |
|---|---|---|---|---|---|---|---|---|---|---|---|---|
| Min °C | 22.5 | 22.8 | 23.2 | 23.5 | 23.9 | 23.8 | 23.5 | 23.4 | 23.2 | 23.1 | 22.9 | 22.7 |
| Max °C | 29.7 | 30.5 | 31 | 31.2 | 31.3 | 31 | 30.6 | 30.6 | 30.6 | 30.8 | 30.3 | 29.5 |
| Min °F | 72.5 | 73.1 | 73.7 | 74.3 | 75 | 74.9 | 74.3 | 74.1 | 73.8 | 73.6 | 73.2 | 72.8 |
| Max °F | 79 | 80 | 80.7 | 81.2 | 81.6 | 81.3 | 80.7 | 80.5 | 80.5 | 80.6 | 79.9 | 79 |
Sea temperature
The graph below shows the average sea temperature.
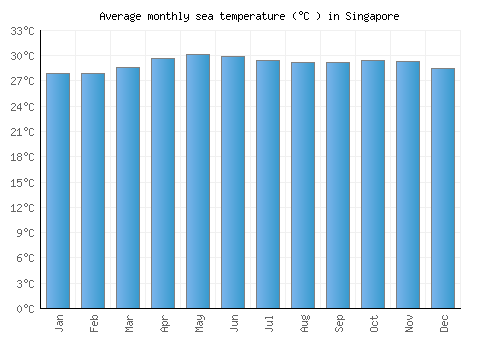
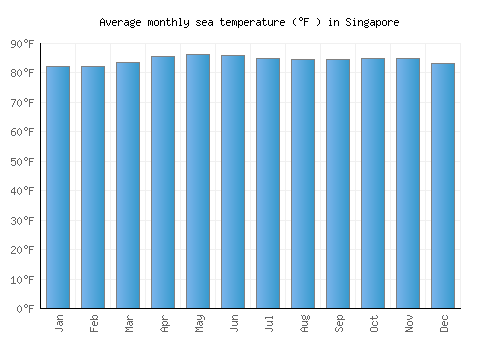
| Jan | Feb | Mar | Apr | May | Jun | Jul | Aug | Sep | Oct | Nov | Dec | |
|---|---|---|---|---|---|---|---|---|---|---|---|---|
| °C | 27.9 | 27.9 | 28.6 | 29.7 | 30.1 | 29.9 | 29.4 | 29.2 | 29.2 | 29.5 | 29.3 | 28.5 |
| °F | 82.2 | 82.2 | 83.5 | 85.4 | 86.2 | 85.8 | 85 | 84.5 | 84.5 | 85 | 84.8 | 83.3 |
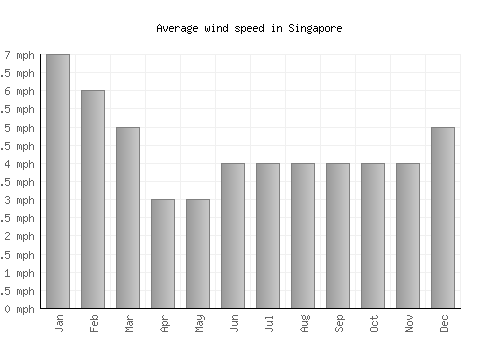
Wind speed
The graph below shows the average wind speed.
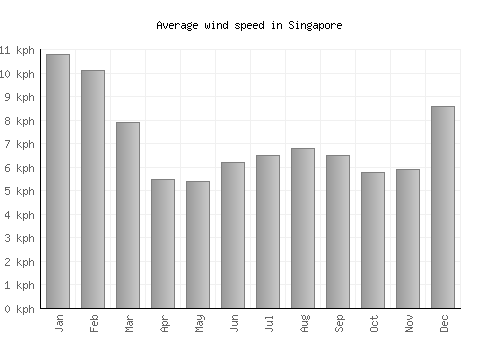
| Jan | Feb | Mar | Apr | May | Jun | Jul | Aug | Sep | Oct | Nov | Dec | |
|---|---|---|---|---|---|---|---|---|---|---|---|---|
| km/h | 11 | 10 | 8 | 6 | 5 | 6 | 7 | 7 | 7 | 6 | 6 | 9 |
| mph | 7 | 6 | 5 | 3 | 3 | 4 | 4 | 4 | 4 | 4 | 4 | 5 |
A monthly average windspeed of over 16km/h or 10mph suggests a location is fairly windy.
Relative humidity
The graph below shows the average relative humidity.
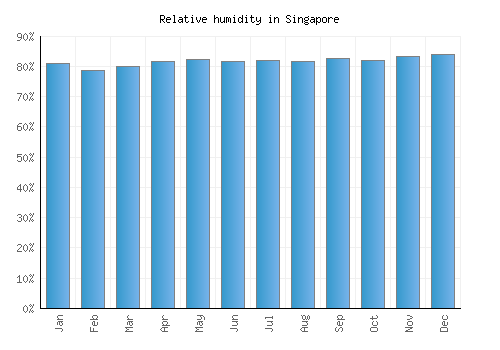
| Jan | Feb | Mar | Apr | May | Jun | Jul | Aug | Sep | Oct | Nov | Dec |
|---|---|---|---|---|---|---|---|---|---|---|---|
| 81% | 79% | 80% | 82% | 82% | 82% | 82% | 82% | 83% | 82% | 83% | 84% |
Other monthly averages
Singapore weather stats
| Hottest month: | May | 31.1°C 88°F |
|---|---|---|
| Driest month: | June | 159mm 6.3ins |
| Sunniest month: | February | 6.8hrs |
| Coldest month: | December | 29.4°C 84.9°F |
| Wettest month: | December | 296mm 11.7ins |
| Warmest sea: | May | 30.1°C 86.2°F |