Seoul monthly weather averages
What's the weather like in Seoul?
Seoul has a humid continental climate consisting of warm, humid summers and dry winters. The city is located in the northern part of South Korea, which means that it experiences four distinct seasons.
The spring (April to June) is a probably the best time to visit Seoul. The weather is mild and sunny, with average temperatures ranging from 10°C (50°F) to 20°C (68°F). The cherry blossoms usually bloom in late April or early May, making this a popular time for tourists to visit the city.
The summer (July to August) is hot and humid, with average temperatures ranging from 25°C (77°F) to 30°C (86°F). The monsoon rains bring heavy rainfall during this time of year, so it's important to pack an umbrella.
The autumn/fall (September to November) is another great time to visit Seoul. The weather is mild and sunny, with average temperatures ranging from 15°C (59°F) to 25°C (77°F). The leaves on the trees change color in the autumn, making this a beautiful time to visit the city's many parks.
The winter (December to March) is cold and dry, with average temperatures ranging from 0°C (32°F) to 10°C (50°F). Snowfall is common in the winter, so it's important to pack warm clothes.
Overall, Seoul has a temperate climate with four distinct seasons. The best time to visit depends on your personal preferences. If you prefer warm weather, then summer is the best time to visit. If you prefer cooler weather, then spring, autumn, or winter are better options.
Average daytime temperature
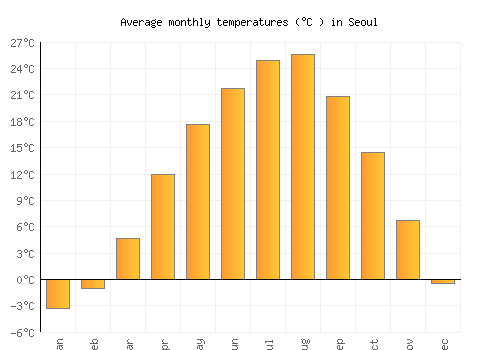
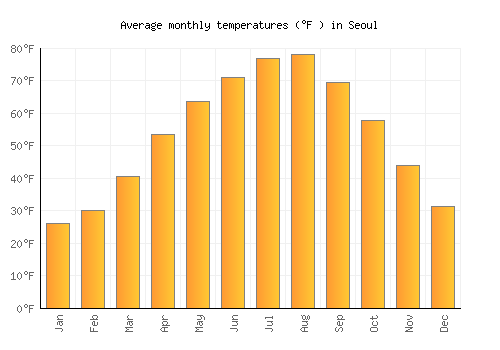
The bar chart below shows the average monthly peak daytime temperatures at Seoul
| Jan | Feb | Mar | Apr | May | Jun | Jul | Aug | Sep | Oct | Nov | Dec | |
|---|---|---|---|---|---|---|---|---|---|---|---|---|
| °C | 0.9 | 3.2 | 9.3 | 17.1 | 22.7 | 26.1 | 28.3 | 29.2 | 25.3 | 19.5 | 11.1 | 3.6 |
| °F | 33.6 | 37.7 | 48.7 | 62.8 | 72.9 | 79 | 82.9 | 84.6 | 77.6 | 67.2 | 51.9 | 38.6 |
Please note: these are the average peak daytime temperatures (usually around mid-afternoon) so do not show daytime / night highs and lows. To see the daily range of temperatures have a look at the temperature max / min chart below.
Average rainfall & rainy days
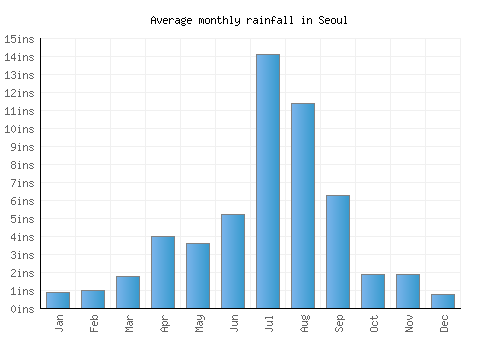
The graph below shows the average rainfall and number of rainy days per month.

| Jan | Feb | Mar | Apr | May | Jun | Jul | Aug | Sep | Oct | Nov | Dec | |
|---|---|---|---|---|---|---|---|---|---|---|---|---|
| mm | 22 | 26 | 45 | 102 | 90 | 133 | 358 | 289 | 161 | 49 | 48 | 21 |
| inches | 0.9 | 1 | 1.8 | 4 | 3.6 | 5.2 | 14.1 | 11.4 | 6.3 | 1.9 | 1.9 | 0.8 |
| Rainy days | 7 | 6 | 7 | 8 | 8 | 10 | 16 | 13 | 9 | 6 | 10 | 7 |
Average annual rainfall in Seoul: 1507.1mm (593.3 inches)
Average daily sunshine
The bar chart below shows the average daily sunshine hours in Seoul
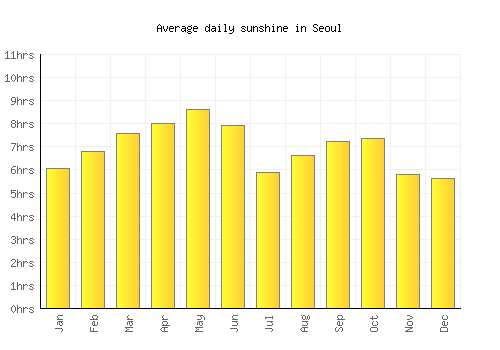
| Jan | Feb | Mar | Apr | May | Jun | Jul | Aug | Sep | Oct | Nov | Dec | |
|---|---|---|---|---|---|---|---|---|---|---|---|---|
| Hrs sunshine | 6 | 6.8 | 7.6 | 8 | 8.6 | 7.9 | 5.9 | 6.6 | 7.2 | 7.3 | 5.8 | 5.6 |
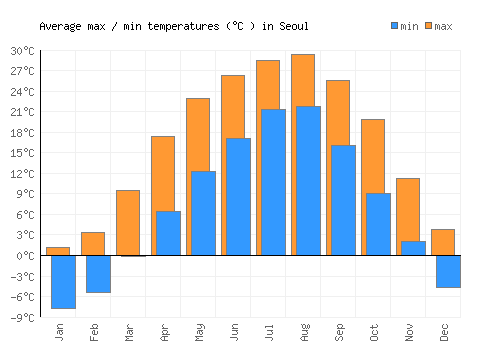
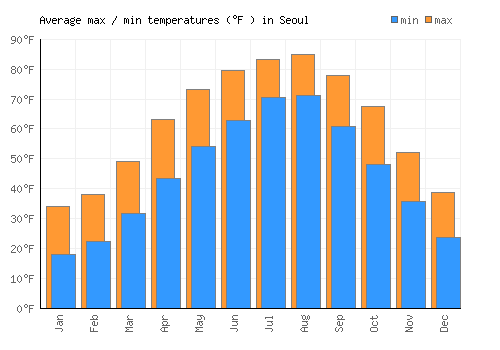
Day / night temperatures
The graph below shows the daily range of temperatures for each month.
| Jan | Feb | Mar | Apr | May | Jun | Jul | Aug | Sep | Oct | Nov | Dec | |
|---|---|---|---|---|---|---|---|---|---|---|---|---|
| Min °C | -7.7 | -5.4 | -0.1 | 6.5 | 12.3 | 17.1 | 21.4 | 21.8 | 16.1 | 9 | 2.1 | -4.7 |
| Max °C | 1.1 | 3.4 | 9.5 | 17.4 | 23 | 26.4 | 28.5 | 29.4 | 25.6 | 19.8 | 11.3 | 3.9 |
| Min °F | 18.1 | 22.3 | 31.8 | 43.6 | 54.1 | 62.7 | 70.4 | 71.2 | 60.9 | 48.2 | 35.8 | 23.6 |
| Max °F | 26.1 | 30.2 | 40.5 | 53.4 | 63.7 | 71.1 | 76.8 | 78.1 | 69.4 | 57.9 | 44.1 | 31.3 |
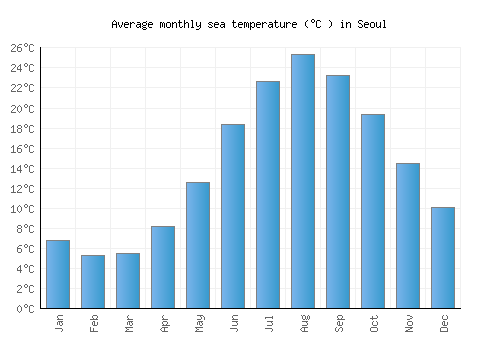
Sea temperature
The graph below shows the average sea temperature.
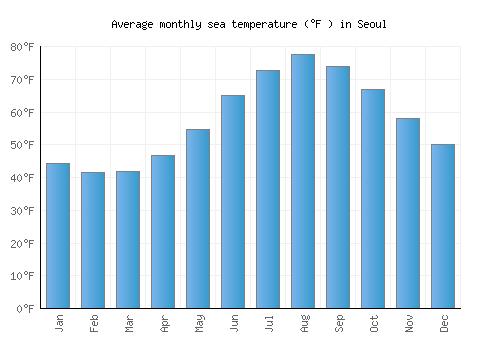
| Jan | Feb | Mar | Apr | May | Jun | Jul | Aug | Sep | Oct | Nov | Dec | |
|---|---|---|---|---|---|---|---|---|---|---|---|---|
| °C | 6.8 | 5.3 | 5.5 | 8.1 | 12.5 | 18.3 | 22.7 | 25.3 | 23.2 | 19.3 | 14.5 | 10.1 |
| °F | 44.2 | 41.5 | 41.9 | 46.6 | 54.6 | 65 | 72.8 | 77.6 | 73.8 | 66.8 | 58 | 50.1 |
Wind speed
The graph below shows the average wind speed.
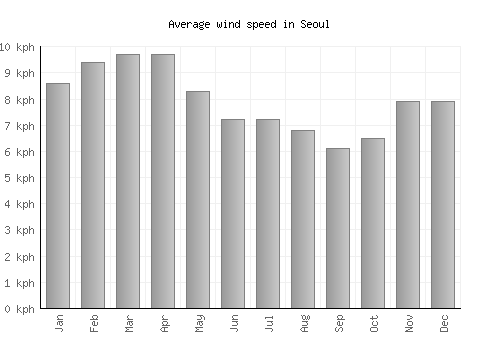
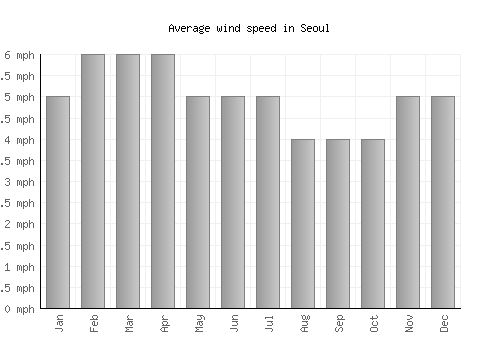
| Jan | Feb | Mar | Apr | May | Jun | Jul | Aug | Sep | Oct | Nov | Dec | |
|---|---|---|---|---|---|---|---|---|---|---|---|---|
| km/h | 9 | 9 | 10 | 10 | 8 | 7 | 7 | 7 | 6 | 7 | 8 | 8 |
| mph | 5 | 6 | 6 | 6 | 5 | 5 | 5 | 4 | 4 | 4 | 5 | 5 |
A monthly average windspeed of over 16km/h or 10mph suggests a location is fairly windy.
Relative humidity
The graph below shows the average relative humidity.
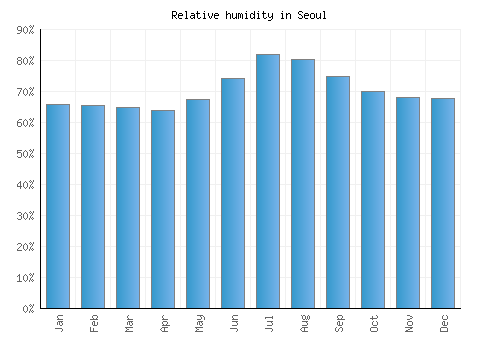
| Jan | Feb | Mar | Apr | May | Jun | Jul | Aug | Sep | Oct | Nov | Dec |
|---|---|---|---|---|---|---|---|---|---|---|---|
| 66% | 65% | 65% | 64% | 67% | 74% | 82% | 80% | 75% | 70% | 68% | 68% |
Other monthly averages
Seoul weather stats
| Hottest month: | August | 29.2°C 84.6°F |
|---|---|---|
| Driest month: | December | 21mm 0.8ins |
| Sunniest month: | October | 7.3hrs |
| Coldest month: | January | 0.9°C 33.6°F |
| Wettest month: | July | 358mm 14.1ins |
| Warmest sea: | August | 25.3°C 77.5°F |