Bangkok monthly weather averages
What's the weather like in Bangkok?
Bangkok, the capital of Thailand, is known for its year-round tropical climate. The city experiences hot and humid weather throughout the year, with temperatures commonly reaching the high-80s to low-90s ° Fahrenheit range (30-35 ° Celsius). The city gets most of its rainfall during monsoon season from May to October. The rest of the year tends to be dry, with sunny skies although the humidity remains high.
The city's location in the Gulf of Thailand also makes it susceptible to tropical storms from May to October. During this time, the city may experience additional heavy rains, flooding, and even high winds.
The winter months (December to February) in Bangkok tend to be a little milder which makes them a good time to visit the city.
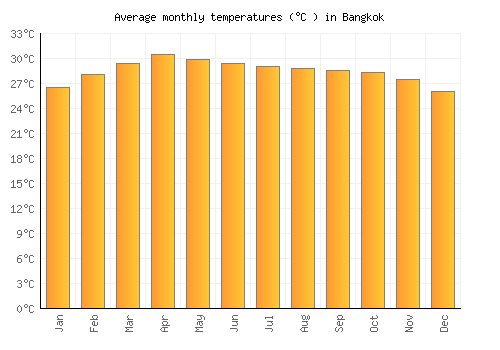
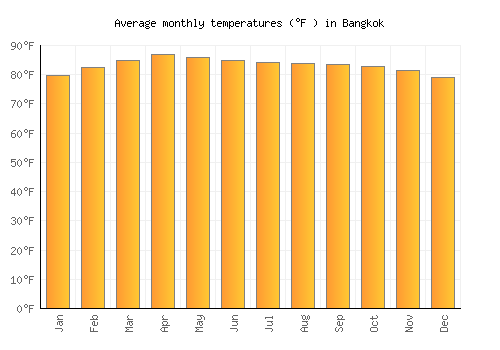
Average daytime temperature
The bar chart below shows the average monthly peak daytime temperatures at Bangkok
| Jan | Feb | Mar | Apr | May | Jun | Jul | Aug | Sep | Oct | Nov | Dec | |
|---|---|---|---|---|---|---|---|---|---|---|---|---|
| °C | 31.7 | 32.6 | 33.6 | 34.7 | 33.9 | 33.1 | 32.7 | 32.4 | 32.2 | 31.9 | 31.5 | 31.1 |
| °F | 89.1 | 90.7 | 92.5 | 94.5 | 93 | 91.5 | 90.8 | 90.3 | 90 | 89.4 | 88.7 | 87.9 |
Please note: these are the average peak daytime temperatures (usually around mid-afternoon) so do not show daytime / night highs and lows. To see the daily range of temperatures have a look at the temperature max / min chart below.
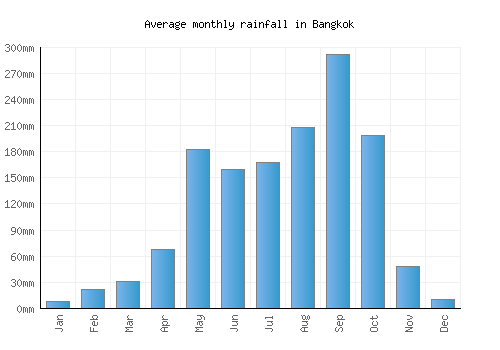
Average rainfall & rainy days
The graph below shows the average rainfall and number of rainy days per month.

| Jan | Feb | Mar | Apr | May | Jun | Jul | Aug | Sep | Oct | Nov | Dec | |
|---|---|---|---|---|---|---|---|---|---|---|---|---|
| mm | 8 | 21 | 31 | 68 | 182 | 160 | 167 | 208 | 292 | 199 | 49 | 11 |
| inches | 0.3 | 0.8 | 1.2 | 2.7 | 7.2 | 6.3 | 6.6 | 8.2 | 11.5 | 7.8 | 1.9 | 0.4 |
| Rainy days | 1 | 3 | 3 | 6 | 15 | 15 | 17 | 19 | 20 | 16 | 6 | 1 |
Average annual rainfall in Bangkok: 1508.333mm (593.8 inches)
Average daily sunshine
The bar chart below shows the average daily sunshine hours in Bangkok
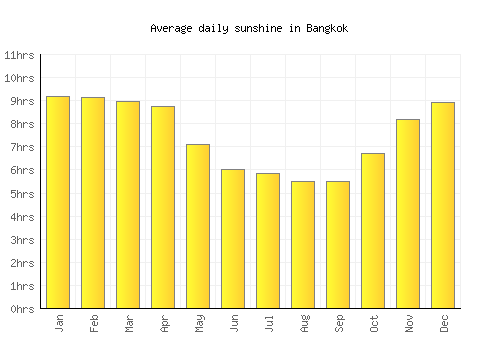
| Jan | Feb | Mar | Apr | May | Jun | Jul | Aug | Sep | Oct | Nov | Dec | |
|---|---|---|---|---|---|---|---|---|---|---|---|---|
| Hrs sunshine | 9.2 | 9.1 | 9 | 8.8 | 7.1 | 6 | 5.8 | 5.5 | 5.5 | 6.7 | 8.2 | 8.9 |
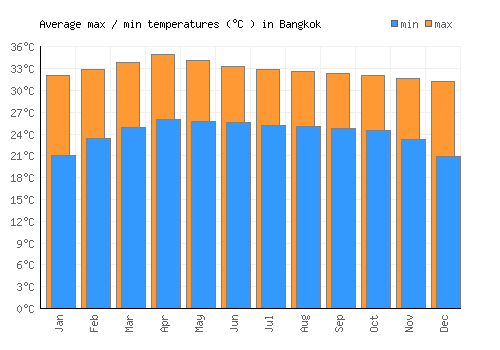
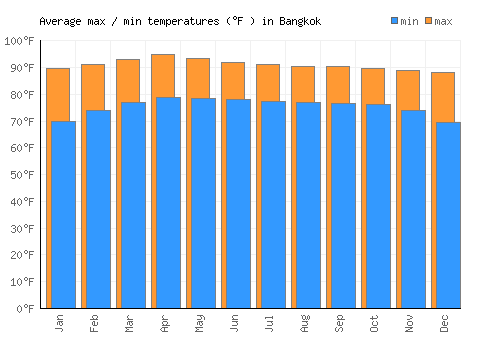
Day / night temperatures
The graph below shows the daily range of temperatures for each month.
| Jan | Feb | Mar | Apr | May | Jun | Jul | Aug | Sep | Oct | Nov | Dec | |
|---|---|---|---|---|---|---|---|---|---|---|---|---|
| Min °C | 21 | 23.4 | 25 | 26.1 | 25.7 | 25.6 | 25.2 | 25.1 | 24.8 | 24.6 | 23.3 | 20.9 |
| Max °C | 32 | 32.9 | 33.9 | 35 | 34.1 | 33.3 | 32.9 | 32.6 | 32.4 | 32.1 | 31.7 | 31.3 |
| Min °F | 69.8 | 74 | 76.9 | 78.9 | 78.3 | 78 | 77.3 | 77.1 | 76.6 | 76.2 | 73.9 | 69.6 |
| Max °F | 79.7 | 82.6 | 84.9 | 86.9 | 85.8 | 84.9 | 84.2 | 83.8 | 83.5 | 82.9 | 81.5 | 79 |
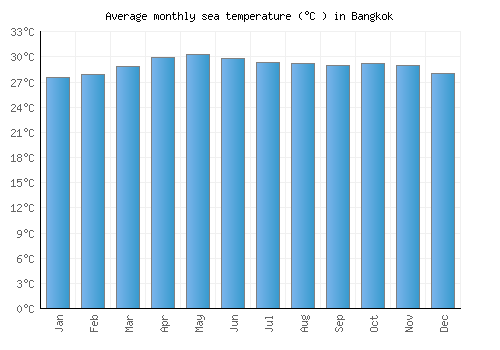
Sea temperature
The graph below shows the average sea temperature.
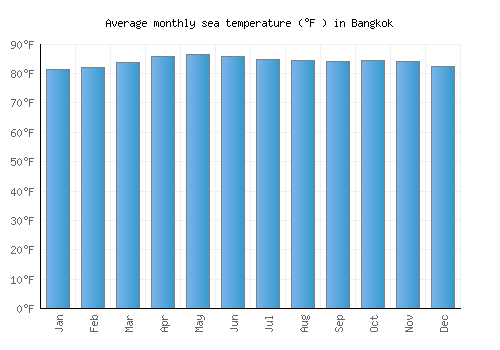
| Jan | Feb | Mar | Apr | May | Jun | Jul | Aug | Sep | Oct | Nov | Dec | |
|---|---|---|---|---|---|---|---|---|---|---|---|---|
| °C | 27.5 | 27.9 | 28.8 | 29.9 | 30.3 | 29.8 | 29.4 | 29.2 | 29 | 29.2 | 29 | 28 |
| °F | 81.5 | 82.2 | 83.9 | 85.8 | 86.5 | 85.7 | 84.9 | 84.5 | 84.2 | 84.5 | 84.1 | 82.4 |
Wind speed
The graph below shows the average wind speed.
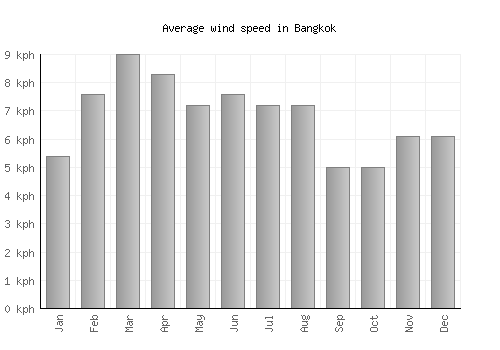
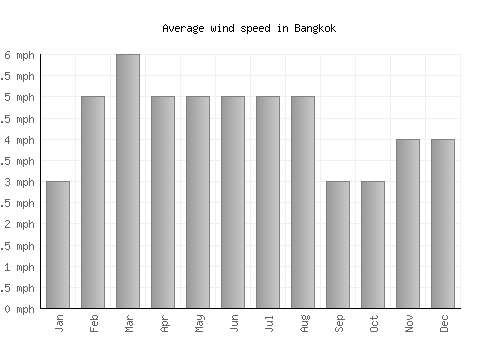
| Jan | Feb | Mar | Apr | May | Jun | Jul | Aug | Sep | Oct | Nov | Dec | |
|---|---|---|---|---|---|---|---|---|---|---|---|---|
| km/h | 5 | 8 | 9 | 8 | 7 | 8 | 7 | 7 | 5 | 5 | 6 | 6 |
| mph | 3 | 5 | 6 | 5 | 5 | 5 | 5 | 5 | 3 | 3 | 4 | 4 |
A monthly average windspeed of over 16km/h or 10mph suggests a location is fairly windy.
Relative humidity
The graph below shows the average relative humidity.
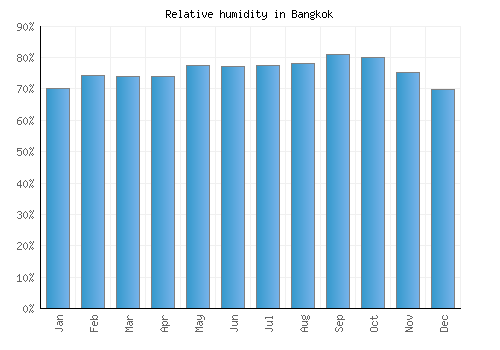
| Jan | Feb | Mar | Apr | May | Jun | Jul | Aug | Sep | Oct | Nov | Dec |
|---|---|---|---|---|---|---|---|---|---|---|---|
| 70% | 74% | 74% | 74% | 77% | 77% | 78% | 78% | 81% | 80% | 75% | 70% |

Other monthly averages
Bangkok weather stats
| Hottest month: | April | 34.7°C 94.5°F |
|---|---|---|
| Driest month: | January | 8mm 0.3ins |
| Sunniest month: | January | 9.2hrs |
| Coldest month: | December | 31.1°C 88°F |
| Wettest month: | September | 292mm 11.5ins |
| Warmest sea: | May | 30.3°C 86.5°F |