Sydney monthly weather averages
What's the weather like in Sydney?
Sydney has a temperate climate, with warm summers and mild winters. The city is located on the east coast of Australia and is subject to the warm oceanic current of the East Australian Current. This current brings warm weather from the tropics in the summer months, but can bring heavy rainfall in the winter months. Sydney also experiences some extreme weather events, such as storms, floods, and cyclones.
Summers are hot and humid in Sydney, with an average high of 25°C (77°F) and average low of 17°C (62°F) - the hottest month is February. The city is also prone to heat waves, with temperatures often hitting the high 30s °C (90s °F) during the summer months. The winter average temperature is a mild 18°C (64°F) although it this goes as low as 12°C (54°F) in July.
Sydney receives an average of 1,200mm of rain per year. Most of this rainfall tends to occur during the summer months (December - February), although rain can be quite heavy in June too.
Sydney is a great place to visit all year round. The weather is generally mild, and there is something to do for everyone, no matter what the season.
Average daytime temperature
The bar chart below shows the average monthly peak daytime temperatures at Sydney
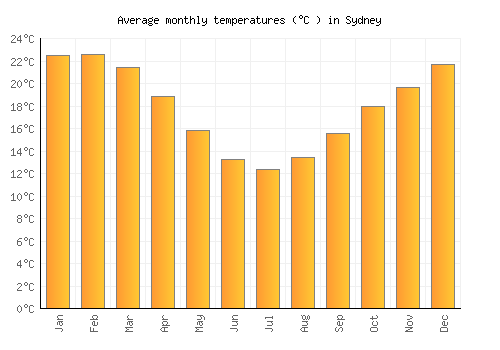
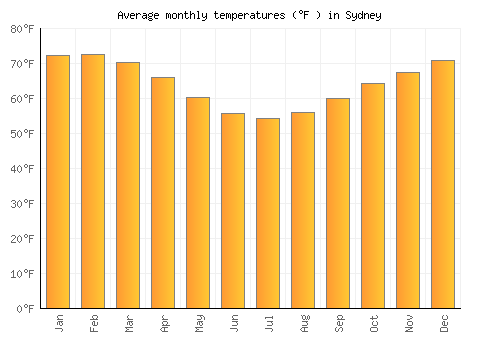
| Jan | Feb | Mar | Apr | May | Jun | Jul | Aug | Sep | Oct | Nov | Dec | |
|---|---|---|---|---|---|---|---|---|---|---|---|---|
| °C | 25.9 | 26 | 25 | 22.9 | 19.9 | 17.3 | 16.9 | 17.9 | 20.1 | 22.1 | 23.6 | 25.4 |
| °F | 78.7 | 78.8 | 76.9 | 73.1 | 67.9 | 63.2 | 62.4 | 64.3 | 68.2 | 71.8 | 74.4 | 77.7 |
Please note: these are the average peak daytime temperatures (usually around mid-afternoon) so do not show daytime / night highs and lows. To see the daily range of temperatures have a look at the temperature max / min chart below.
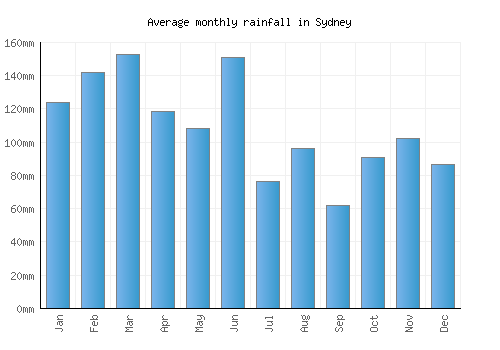
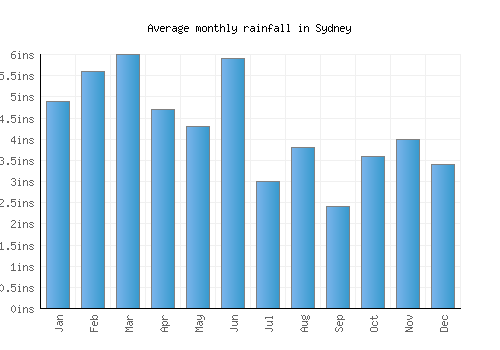
Average rainfall & rainy days
The graph below shows the average rainfall and number of rainy days per month.
| Jan | Feb | Mar | Apr | May | Jun | Jul | Aug | Sep | Oct | Nov | Dec | |
|---|---|---|---|---|---|---|---|---|---|---|---|---|
| mm | 124 | 142 | 153 | 118 | 108 | 151 | 77 | 96 | 62 | 91 | 102 | 86 |
| inches | 4.9 | 5.6 | 6 | 4.7 | 4.3 | 5.9 | 3 | 3.8 | 2.4 | 3.6 | 4 | 3.4 |
| Rainy days | 12 | 12 | 13 | 11 | 11 | 11 | 8 | 10 | 10 | 11 | 12 | 10 |
Average annual rainfall in Sydney: 1426.233mm (561.5 inches)
Average daily sunshine
The bar chart below shows the average daily sunshine hours in Sydney
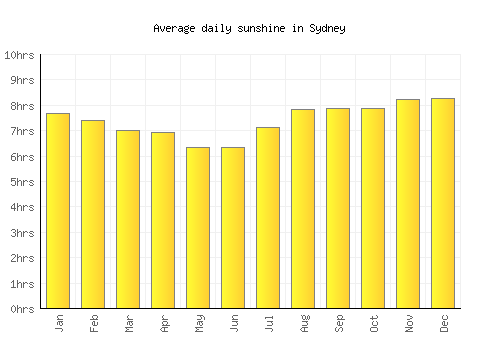
| Jan | Feb | Mar | Apr | May | Jun | Jul | Aug | Sep | Oct | Nov | Dec | |
|---|---|---|---|---|---|---|---|---|---|---|---|---|
| Hrs sunshine | 7.7 | 7.4 | 7 | 6.9 | 6.3 | 6.3 | 7.1 | 7.8 | 7.9 | 7.9 | 8.2 | 8.3 |
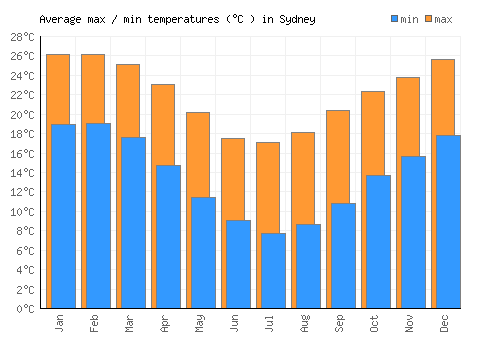
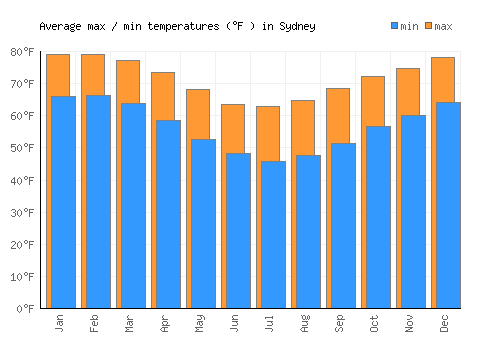
Day / night temperatures
The graph below shows the daily range of temperatures for each month.
| Jan | Feb | Mar | Apr | May | Jun | Jul | Aug | Sep | Oct | Nov | Dec | |
|---|---|---|---|---|---|---|---|---|---|---|---|---|
| Min °C | 18.9 | 19.1 | 17.7 | 14.8 | 11.5 | 9.1 | 7.7 | 8.7 | 10.9 | 13.7 | 15.7 | 17.8 |
| Max °C | 26.1 | 26.2 | 25.2 | 23.1 | 20.2 | 17.6 | 17.1 | 18.2 | 20.4 | 22.3 | 23.8 | 25.6 |
| Min °F | 66 | 66.3 | 63.8 | 58.6 | 52.6 | 48.3 | 45.9 | 47.6 | 51.5 | 56.7 | 60.2 | 64 |
| Max °F | 72.5 | 72.7 | 70.5 | 66 | 60.4 | 55.9 | 54.3 | 56.1 | 60.1 | 64.4 | 67.5 | 71.1 |
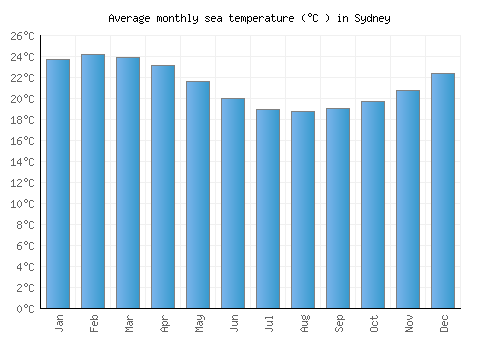
Sea temperature
The graph below shows the average sea temperature.
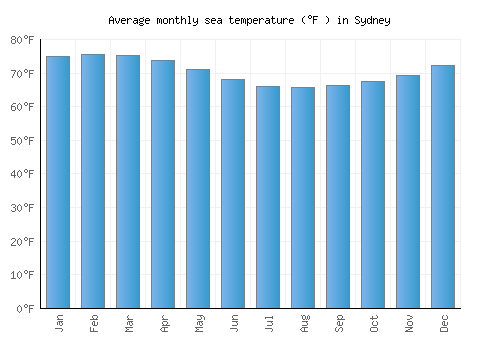
| Jan | Feb | Mar | Apr | May | Jun | Jul | Aug | Sep | Oct | Nov | Dec | |
|---|---|---|---|---|---|---|---|---|---|---|---|---|
| °C | 23.8 | 24.2 | 23.9 | 23.1 | 21.6 | 20 | 18.9 | 18.8 | 19 | 19.7 | 20.7 | 22.4 |
| °F | 74.8 | 75.5 | 75.1 | 73.6 | 70.9 | 68 | 66.1 | 65.8 | 66.3 | 67.4 | 69.3 | 72.3 |
Wind speed
The graph below shows the average wind speed.
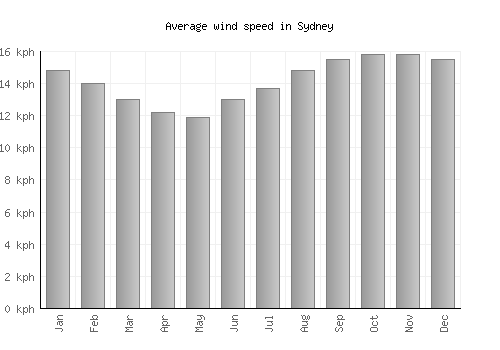
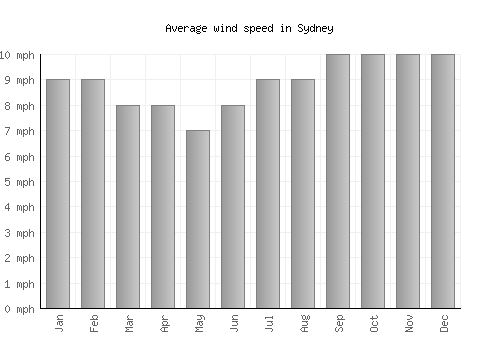
| Jan | Feb | Mar | Apr | May | Jun | Jul | Aug | Sep | Oct | Nov | Dec | |
|---|---|---|---|---|---|---|---|---|---|---|---|---|
| km/h | 15 | 14 | 13 | 12 | 12 | 13 | 14 | 15 | 16 | 16 | 16 | 16 |
| mph | 9 | 9 | 8 | 8 | 7 | 8 | 9 | 9 | 10 | 10 | 10 | 10 |
A monthly average windspeed of over 16km/h or 10mph suggests a location is fairly windy.
Relative humidity
The graph below shows the average relative humidity.
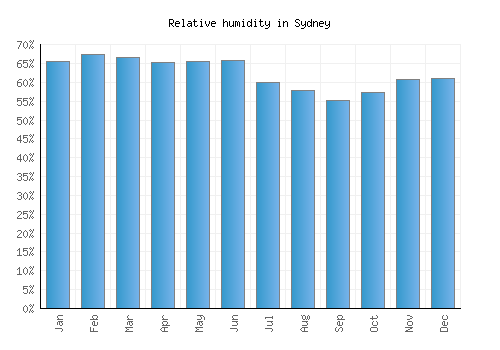
| Jan | Feb | Mar | Apr | May | Jun | Jul | Aug | Sep | Oct | Nov | Dec |
|---|---|---|---|---|---|---|---|---|---|---|---|
| 66% | 67% | 67% | 65% | 66% | 66% | 60% | 58% | 55% | 57% | 61% | 61% |

Other monthly averages
Sydney weather stats
| Hottest month: | February | 26°C 78.8°F |
|---|---|---|
| Driest month: | September | 62mm 2.4ins |
| Sunniest month: | August | 7.8hrs |
| Coldest month: | July | 16.9°C 62.4°F |
| Wettest month: | March | 153mm 6ins |
| Warmest sea: | February | 24.2°C 75.6°F |

Locations nearby
Top Australia locations
- Adelaide
- Alice Springs
- Brisbane
- Cairns
- Canberra
- Darwin
- Hobart
- Kakadu National Park
- Melbourne
- Noosa Heads
- Perth
- Port Douglas
- Sydney