Auckland monthly weather averages
What's the weather like in Auckland?
Auckland, New Zealand has a subtropical climate, with warm, humid summers and mild, wet winters. The city receives around 2,000 hours of sunshine each year, with temperatures rarely dropping below 10°C (50°F) or rising above 28°C (82°F).
Rainfall is quite consistent throughout the year, but there is a marked decrease from October to February. The wettest months are usually June and July. Auckland is also fairly sheltered from strong winds, and storms are rare.
Spring in Auckland is mild and pleasant, with temperatures beginning to rise in September and October. Summers are typically warm and humid, with temperatures in the mid-20s (Celsius) and high levels of humidity during December and January.
Autumn is a pleasant season in Auckland, with temperatures dropping off in April and May and the rain beginning to increase.
Overall, Auckland has a pleasant and moderate climate, making it an ideal place to visit year-round.
Average daytime temperature
The bar chart below shows the average monthly peak daytime temperatures at Auckland
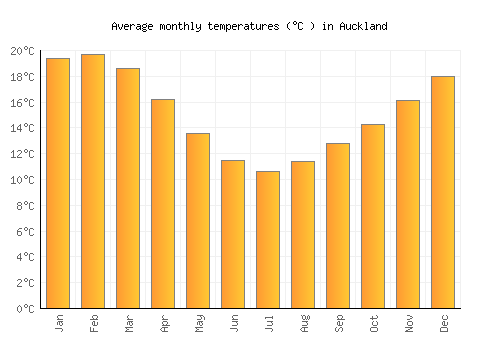
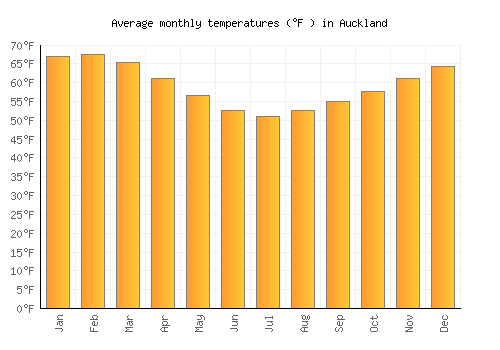
| Jan | Feb | Mar | Apr | May | Jun | Jul | Aug | Sep | Oct | Nov | Dec | |
|---|---|---|---|---|---|---|---|---|---|---|---|---|
| °C | 23.1 | 23.4 | 22.3 | 19.8 | 17.1 | 14.9 | 14.1 | 14.8 | 16.1 | 17.6 | 19.6 | 21.6 |
| °F | 73.5 | 74.1 | 72.1 | 67.6 | 62.8 | 58.8 | 57.4 | 58.6 | 61 | 63.7 | 67.2 | 70.8 |
Please note: these are the average peak daytime temperatures (usually around mid-afternoon) so do not show daytime / night highs and lows. To see the daily range of temperatures have a look at the temperature max / min chart below.
Average rainfall & rainy days
The graph below shows the average rainfall and number of rainy days per month.

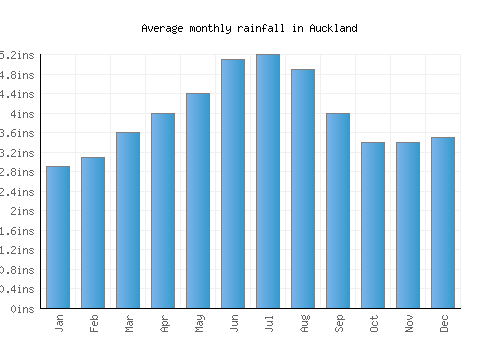
| Jan | Feb | Mar | Apr | May | Jun | Jul | Aug | Sep | Oct | Nov | Dec | |
|---|---|---|---|---|---|---|---|---|---|---|---|---|
| mm | 75 | 80 | 92 | 102 | 111 | 130 | 133 | 124 | 101 | 86 | 86 | 89 |
| inches | 2.9 | 3.1 | 3.6 | 4 | 4.4 | 5.1 | 5.2 | 4.9 | 4 | 3.4 | 3.4 | 3.5 |
| Rainy days | 11 | 9 | 12 | 14 | 17 | 19 | 19 | 19 | 18 | 15 | 14 | 13 |
Average annual rainfall in Auckland: 1346.333mm (530.1 inches)
Average daily sunshine
The bar chart below shows the average daily sunshine hours in Auckland
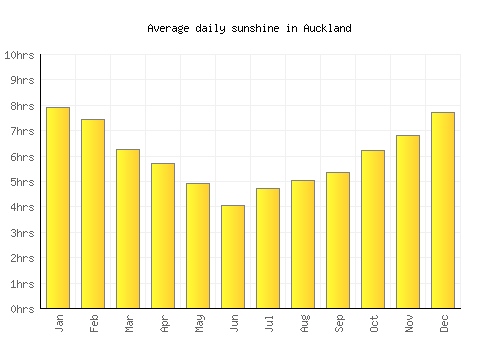
| Jan | Feb | Mar | Apr | May | Jun | Jul | Aug | Sep | Oct | Nov | Dec | |
|---|---|---|---|---|---|---|---|---|---|---|---|---|
| Hrs sunshine | 7.9 | 7.4 | 6.3 | 5.7 | 4.9 | 4 | 4.7 | 5 | 5.3 | 6.2 | 6.8 | 7.7 |
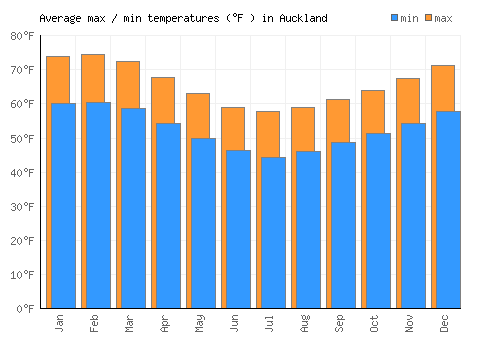
Day / night temperatures
The graph below shows the daily range of temperatures for each month.
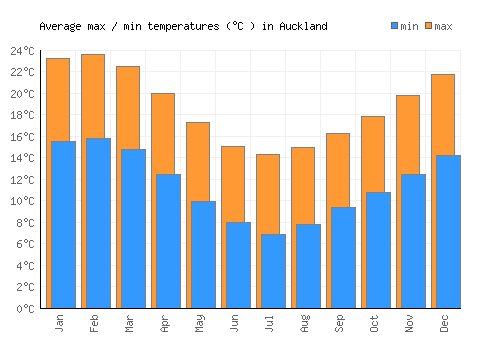
| Jan | Feb | Mar | Apr | May | Jun | Jul | Aug | Sep | Oct | Nov | Dec | |
|---|---|---|---|---|---|---|---|---|---|---|---|---|
| Min °C | 15.6 | 15.8 | 14.8 | 12.5 | 9.9 | 8 | 6.9 | 7.9 | 9.4 | 10.8 | 12.5 | 14.3 |
| Max °C | 23.3 | 23.6 | 22.5 | 20 | 17.3 | 15.1 | 14.3 | 15 | 16.3 | 17.8 | 19.8 | 21.8 |
| Min °F | 60 | 60.4 | 58.6 | 54.4 | 49.8 | 46.3 | 44.4 | 46.1 | 48.8 | 51.4 | 54.4 | 57.7 |
| Max °F | 66.9 | 67.5 | 65.5 | 61.2 | 56.5 | 52.7 | 51.1 | 52.5 | 55 | 57.7 | 61 | 64.4 |
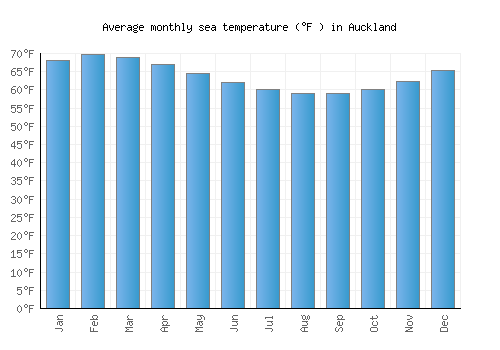
Sea temperature
The graph below shows the average sea temperature.
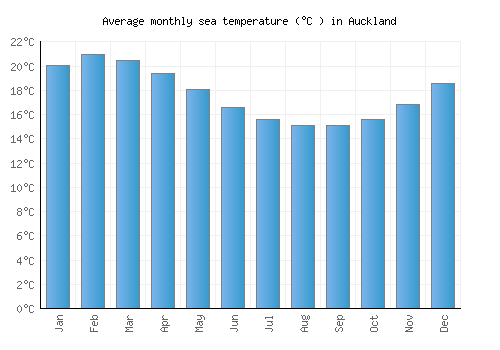
| Jan | Feb | Mar | Apr | May | Jun | Jul | Aug | Sep | Oct | Nov | Dec | |
|---|---|---|---|---|---|---|---|---|---|---|---|---|
| °C | 20.1 | 21 | 20.5 | 19.4 | 18 | 16.6 | 15.6 | 15.1 | 15.1 | 15.6 | 16.8 | 18.5 |
| °F | 68.1 | 69.7 | 68.8 | 67 | 64.5 | 61.9 | 60.2 | 59.1 | 59.1 | 60.1 | 62.3 | 65.4 |
Wind speed
The graph below shows the average wind speed.
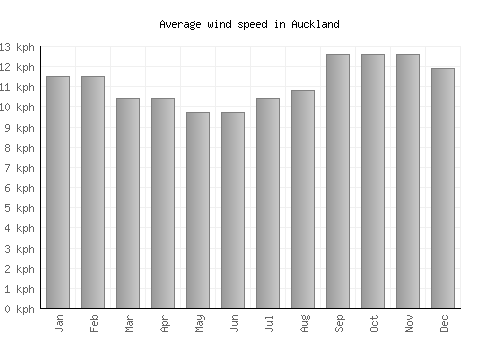
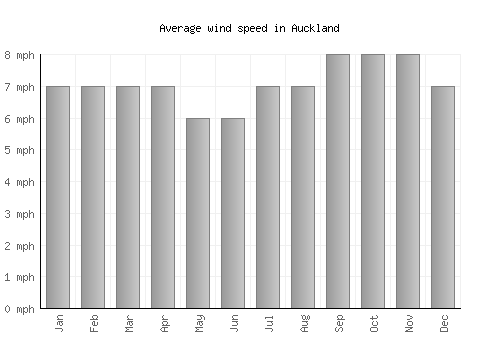
| Jan | Feb | Mar | Apr | May | Jun | Jul | Aug | Sep | Oct | Nov | Dec | |
|---|---|---|---|---|---|---|---|---|---|---|---|---|
| km/h | 12 | 12 | 10 | 10 | 10 | 10 | 10 | 11 | 13 | 13 | 13 | 12 |
| mph | 7 | 7 | 7 | 7 | 6 | 6 | 7 | 7 | 8 | 8 | 8 | 7 |
A monthly average windspeed of over 16km/h or 10mph suggests a location is fairly windy.
Relative humidity
The graph below shows the average relative humidity.
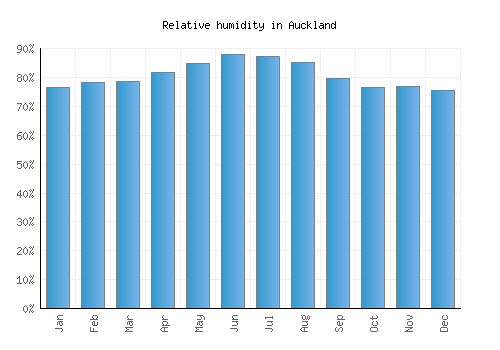
| Jan | Feb | Mar | Apr | May | Jun | Jul | Aug | Sep | Oct | Nov | Dec |
|---|---|---|---|---|---|---|---|---|---|---|---|
| 77% | 78% | 79% | 82% | 85% | 88% | 87% | 85% | 80% | 77% | 77% | 75% |

Other monthly averages
Auckland weather stats
| Hottest month: | February | 23.4°C 74.1°F |
|---|---|---|
| Driest month: | January | 75mm 3ins |
| Sunniest month: | February | 7.4hrs |
| Coldest month: | July | 14.1°C 57.4°F |
| Wettest month: | July | 133mm 5.2ins |
| Warmest sea: | February | 21°C 69.8°F |

Locations nearby
Top New Zealand locations
- Abel Tasman National Park
- Auckland
- Christchurch
- Dunedin
- Kaikoura
- Milford Sound
- Napier
- Nelson
- Queenstown
- Rotorua
- Taupo
- Wanaka
- Wellington