Havana monthly weather averages
What's the weather like in Havana?
Havana has a tropical climate with average temperatures range from 22°C (72°F) in January and February to 28°C (82°F) in August. The temperature rarely drops below 10°C (50°F).
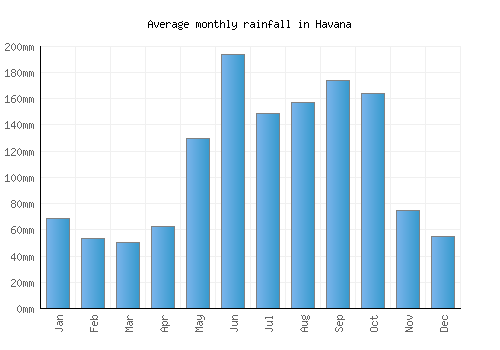
There are distinct seasons in Havana, with the wet season running from May to October, with an average of 1,200 mm (47 in) of rainfall. The driest months are December to April, with an average of 50 mm (2 in) of rainfall.
Havana is located in the hurricane belt, so it is important to be aware of the hurricane season, which runs from June to November. However, most hurricanes strike the south coast of Cuba meaning Havana is typically spared the worst of the storms.
Overall, Havana has a pleasant year-round climate that is perfect for exploring the city's many historical and cultural attractions.
The best time to visit Havana is during the dry season, from December to April. The weather is warm and sunny, with little rainfall. However, it is important to note that this is also the peak tourist season, so prices will be higher and crowds will be larger.
If you are looking for a more affordable and less crowded time to visit Havana, consider visiting during the shoulder seasons (May-June and September-October). The weather is still pleasant during these months, but there is a slightly higher chance of rain.
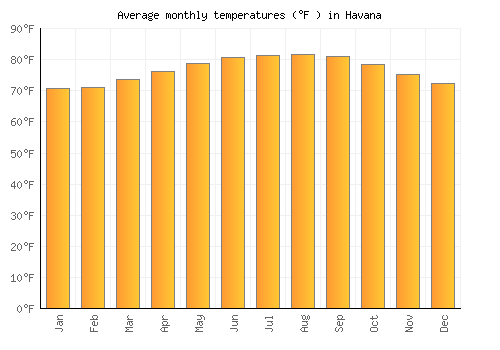
Average daytime temperature
The bar chart below shows the average monthly peak daytime temperatures at Havana
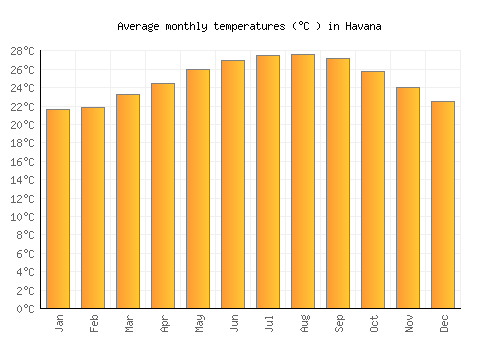
| Jan | Feb | Mar | Apr | May | Jun | Jul | Aug | Sep | Oct | Nov | Dec | |
|---|---|---|---|---|---|---|---|---|---|---|---|---|
| °C | 25.7 | 25.9 | 27.5 | 28.9 | 30.1 | 31 | 31.6 | 31.7 | 31.1 | 29.4 | 27.7 | 26.4 |
| °F | 78.3 | 78.7 | 81.5 | 84.1 | 86.3 | 87.7 | 89 | 89.1 | 87.9 | 85 | 81.9 | 79.5 |
Please note: these are the average peak daytime temperatures (usually around mid-afternoon) so do not show daytime / night highs and lows. To see the daily range of temperatures have a look at the temperature max / min chart below.
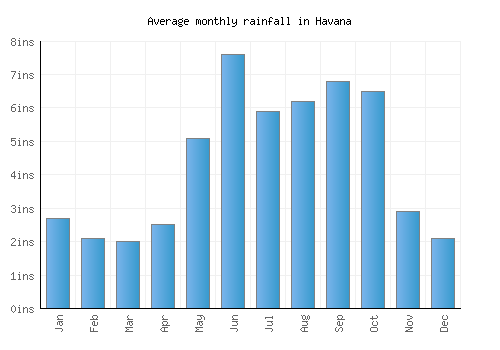
Average rainfall & rainy days
The graph below shows the average rainfall and number of rainy days per month.
| Jan | Feb | Mar | Apr | May | Jun | Jul | Aug | Sep | Oct | Nov | Dec | |
|---|---|---|---|---|---|---|---|---|---|---|---|---|
| mm | 68 | 54 | 50 | 63 | 130 | 194 | 149 | 157 | 174 | 164 | 75 | 55 |
| inches | 2.7 | 2.1 | 2 | 2.5 | 5.1 | 7.6 | 5.9 | 6.2 | 6.8 | 6.5 | 2.9 | 2.1 |
| Rainy days | 6 | 7 | 5 | 5 | 9 | 13 | 10 | 11 | 13 | 13 | 9 | 7 |
Average annual rainfall in Havana: 1273.166mm (501.2 inches)
Average daily sunshine
The bar chart below shows the average daily sunshine hours in Havana
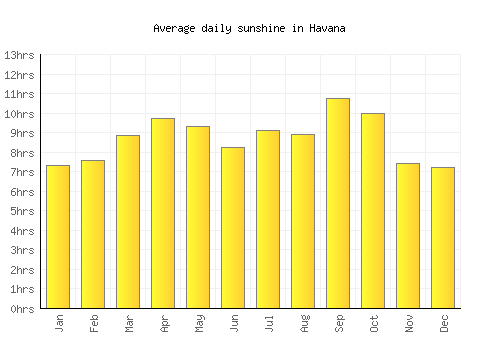
| Jan | Feb | Mar | Apr | May | Jun | Jul | Aug | Sep | Oct | Nov | Dec | |
|---|---|---|---|---|---|---|---|---|---|---|---|---|
| Hrs sunshine | 7.3 | 7.6 | 8.8 | 9.7 | 9.3 | 8.2 | 9.1 | 8.9 | 10.8 | 10 | 7.4 | 7.2 |
Day / night temperatures
The graph below shows the daily range of temperatures for each month.
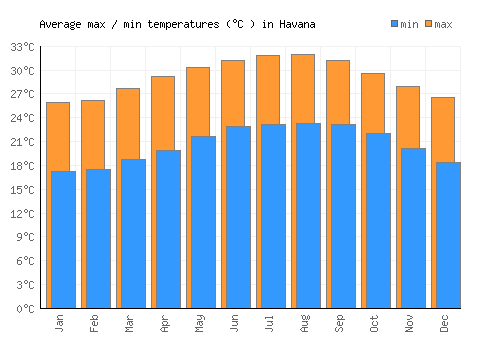
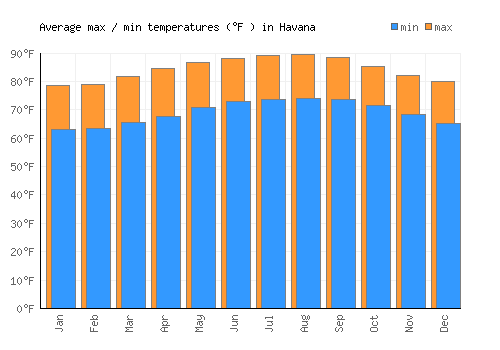
| Jan | Feb | Mar | Apr | May | Jun | Jul | Aug | Sep | Oct | Nov | Dec | |
|---|---|---|---|---|---|---|---|---|---|---|---|---|
| Min °C | 17.3 | 17.5 | 18.7 | 19.9 | 21.7 | 22.9 | 23.2 | 23.3 | 23.2 | 22 | 20.1 | 18.4 |
| Max °C | 26 | 26.2 | 27.7 | 29.2 | 30.4 | 31.2 | 31.9 | 32 | 31.3 | 29.6 | 27.9 | 26.6 |
| Min °F | 63.1 | 63.4 | 65.7 | 67.7 | 71 | 73.1 | 73.7 | 73.9 | 73.7 | 71.6 | 68.2 | 65.1 |
| Max °F | 70.9 | 71.2 | 73.8 | 76.1 | 78.8 | 80.6 | 81.5 | 81.7 | 81 | 78.4 | 75.2 | 72.5 |
Sea temperature
The graph below shows the average sea temperature.
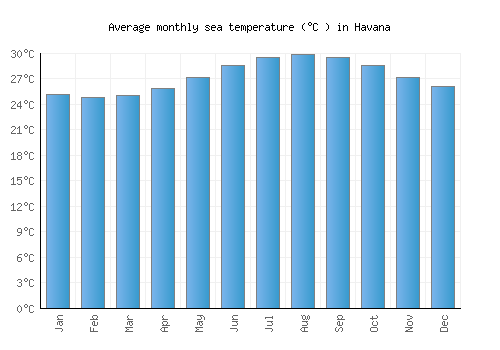
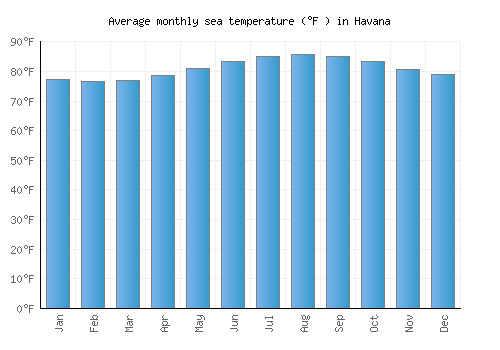
| Jan | Feb | Mar | Apr | May | Jun | Jul | Aug | Sep | Oct | Nov | Dec | |
|---|---|---|---|---|---|---|---|---|---|---|---|---|
| °C | 25.1 | 24.7 | 25 | 25.9 | 27.1 | 28.6 | 29.4 | 29.8 | 29.5 | 28.5 | 27.1 | 26 |
| °F | 77.2 | 76.5 | 76.9 | 78.6 | 80.9 | 83.4 | 85 | 85.7 | 85.1 | 83.4 | 80.8 | 78.9 |
Wind speed
The graph below shows the average wind speed.
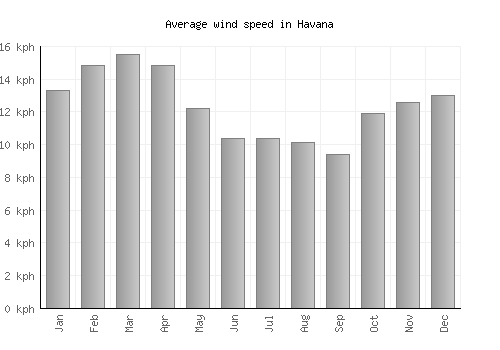
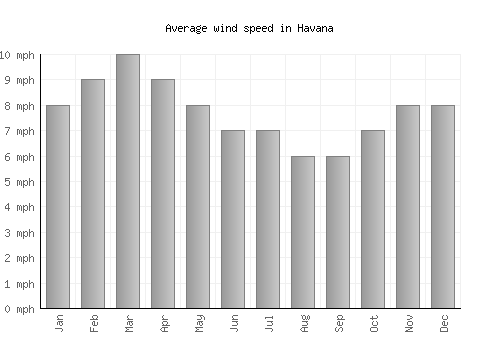
| Jan | Feb | Mar | Apr | May | Jun | Jul | Aug | Sep | Oct | Nov | Dec | |
|---|---|---|---|---|---|---|---|---|---|---|---|---|
| km/h | 13 | 15 | 16 | 15 | 12 | 10 | 10 | 10 | 9 | 12 | 13 | 13 |
| mph | 8 | 9 | 10 | 9 | 8 | 7 | 7 | 6 | 6 | 7 | 8 | 8 |
A monthly average windspeed of over 16km/h or 10mph suggests a location is fairly windy.
Relative humidity
The graph below shows the average relative humidity.
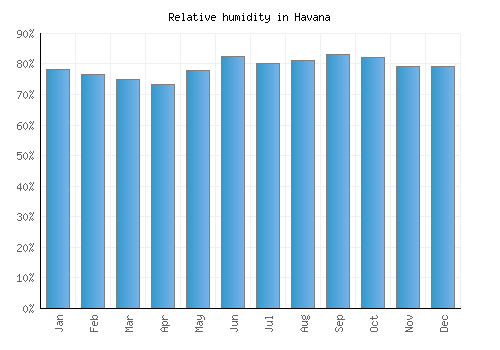
| Jan | Feb | Mar | Apr | May | Jun | Jul | Aug | Sep | Oct | Nov | Dec |
|---|---|---|---|---|---|---|---|---|---|---|---|
| 78% | 77% | 75% | 73% | 78% | 82% | 80% | 81% | 83% | 82% | 79% | 79% |

Other monthly averages
Havana weather stats
| Hottest month: | August | 31.7°C 89.1°F |
|---|---|---|
| Driest month: | March | 50mm 2ins |
| Sunniest month: | September | 10.8hrs |
| Coldest month: | January | 25.7°C 78.3°F |
| Wettest month: | June | 194mm 7.6ins |
| Warmest sea: | August | 29.8°C 85.6°F |

Locations nearby
Top Cuba locations
- Cayo Coco
- Cayo Guillermo
- Cayo Largo del Sur
- Cayo Santa Maria
- Cienfuegos
- Havana
- Santa Clara
- Santiago de Cuba
- Trinidad
- Varadero
- Viñales