Mexico City monthly weather averages
What's the weather like in Mexico City?
Mexico City has a subtropical highland climate due to its tropical location but high elevation. The city is situated at an altitude of 2,240m (7,350 ft) above sea level, which helps to keep temperatures cool throughout the year. The average annual temperature varies from 12 to 16 °C (54 to 61 °F), depending on the altitude of the borough.
The city experiences two distinct seasons: a dry season from November through April, and a wet season from May through October, although it can start as early as April or as late as November. During the dry season, temperatures range from 10°C (50°F) during the cooler months to 25°C (77°F) during the warmer months. During the wet season, temperatures can range from 6°C (43°F) to 29°C (84°F). Mexico City receives around 860mm (34in) of rainfall annually with the heaviest rains usually falling in July and August. The average rainfall for these two months alone is 200 mm (8 in).
The rainy season is caused by the arrival of the tropical air from the ocean. This moisture-laden air from the Caribbean Sea is then forced to rise as it encounters the mountains surrounding Mexico City. This rise in elevation causes the air to cool and condense, resulting in rainfall.
During the, the dry season the weather is generally sunny and warm. The average temperature for these months is 16 °C (61 °F). The driest month is December, with an average rainfall of only 5 mm (0.2 in).
The best time to visit Mexico City is during the spring (April to May) or fall (September to October). The weather is pleasant during these months, with warm temperatures and low humidity. The city is also less crowded during these times of year.
If you are planning to visit during the rainy season, be sure to pack an umbrella and raincoat. The rains can be heavy and sudden, so it is important to be prepared.
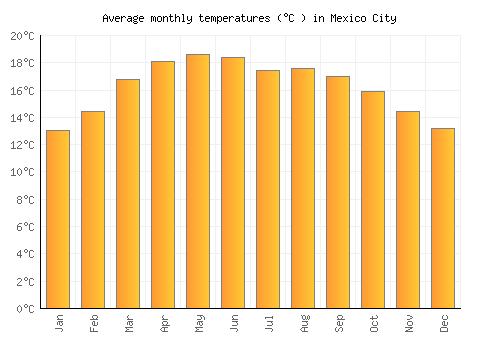
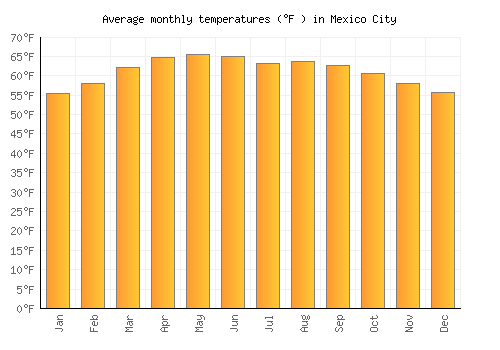
Average daytime temperature
The bar chart below shows the average monthly peak daytime temperatures at Mexico City
| Jan | Feb | Mar | Apr | May | Jun | Jul | Aug | Sep | Oct | Nov | Dec | |
|---|---|---|---|---|---|---|---|---|---|---|---|---|
| °C | 21.8 | 23.6 | 26 | 26.8 | 26.5 | 25 | 23.5 | 24 | 22.9 | 22.8 | 22.4 | 21.5 |
| °F | 71.2 | 74.5 | 78.8 | 80.3 | 79.7 | 76.9 | 74.4 | 75.3 | 73.1 | 73 | 72.2 | 70.8 |
Please note: these are the average peak daytime temperatures (usually around mid-afternoon) so do not show daytime / night highs and lows. To see the daily range of temperatures have a look at the temperature max / min chart below.
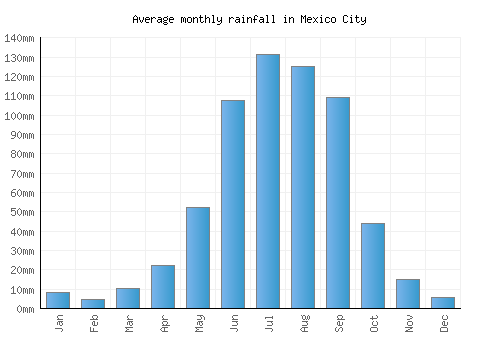
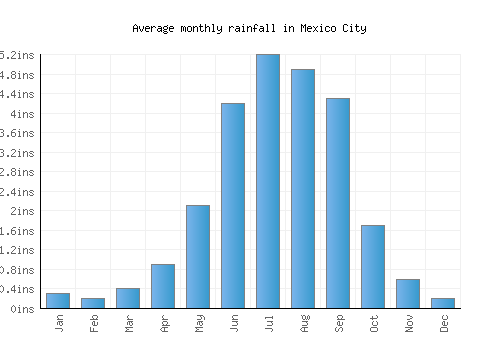
Average rainfall & rainy days
The graph below shows the average rainfall and number of rainy days per month.
| Jan | Feb | Mar | Apr | May | Jun | Jul | Aug | Sep | Oct | Nov | Dec | |
|---|---|---|---|---|---|---|---|---|---|---|---|---|
| mm | 8 | 4 | 11 | 22 | 52 | 108 | 131 | 125 | 109 | 44 | 15 | 6 |
| inches | 0.3 | 0.2 | 0.4 | 0.9 | 2.1 | 4.2 | 5.2 | 4.9 | 4.3 | 1.7 | 0.6 | 0.2 |
| Rainy days | 2 | 1 | 3 | 6 | 10 | 16 | 20 | 19 | 16 | 8 | 4 | 2 |
Average annual rainfall in Mexico City: 555.734mm (218.8 inches)
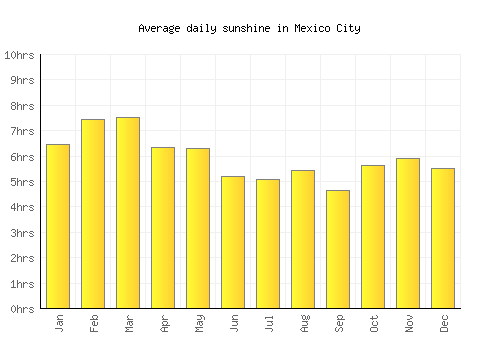
Average daily sunshine
The bar chart below shows the average daily sunshine hours in Mexico City
| Jan | Feb | Mar | Apr | May | Jun | Jul | Aug | Sep | Oct | Nov | Dec | |
|---|---|---|---|---|---|---|---|---|---|---|---|---|
| Hrs sunshine | 6.4 | 7.4 | 7.5 | 6.4 | 6.3 | 5.2 | 5.1 | 5.4 | 4.6 | 5.6 | 5.9 | 5.5 |
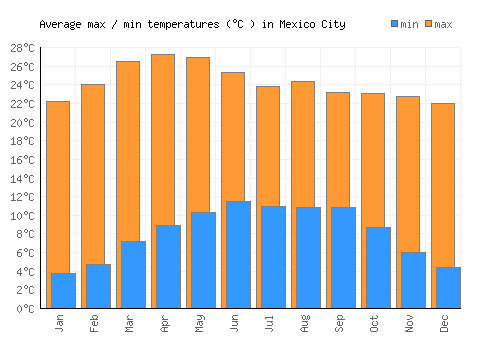
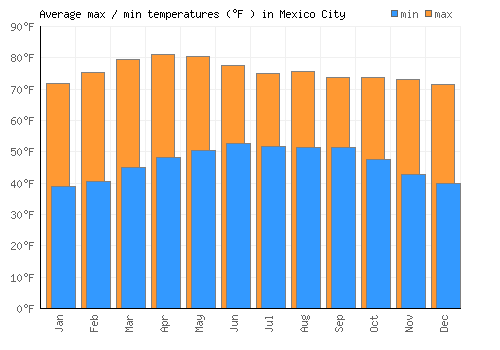
Day / night temperatures
The graph below shows the daily range of temperatures for each month.
| Jan | Feb | Mar | Apr | May | Jun | Jul | Aug | Sep | Oct | Nov | Dec | |
|---|---|---|---|---|---|---|---|---|---|---|---|---|
| Min °C | 3.8 | 4.8 | 7.2 | 9 | 10.3 | 11.5 | 11 | 10.9 | 10.9 | 8.7 | 6.1 | 4.5 |
| Max °C | 22.2 | 24.1 | 26.5 | 27.3 | 26.9 | 25.3 | 23.9 | 24.4 | 23.2 | 23.1 | 22.8 | 22 |
| Min °F | 38.8 | 40.6 | 44.9 | 48.1 | 50.5 | 52.7 | 51.7 | 51.5 | 51.5 | 47.7 | 42.9 | 40 |
| Max °F | 55.4 | 57.9 | 62.2 | 64.6 | 65.5 | 65.1 | 63.3 | 63.7 | 62.6 | 60.6 | 57.9 | 55.8 |
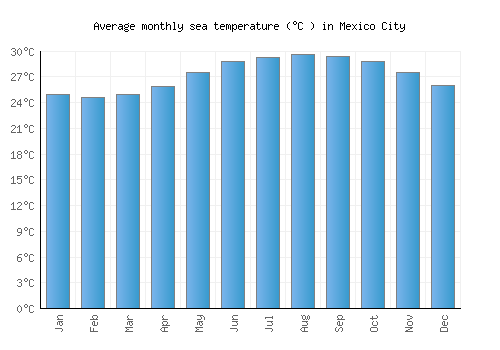
Sea temperature
The graph below shows the average sea temperature.
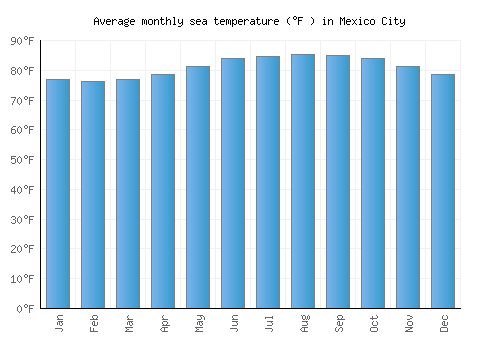
| Jan | Feb | Mar | Apr | May | Jun | Jul | Aug | Sep | Oct | Nov | Dec | |
|---|---|---|---|---|---|---|---|---|---|---|---|---|
| °C | 24.9 | 24.6 | 24.9 | 25.9 | 27.5 | 28.8 | 29.2 | 29.6 | 29.4 | 28.8 | 27.5 | 26 |
| °F | 76.8 | 76.3 | 76.9 | 78.6 | 81.4 | 83.8 | 84.6 | 85.3 | 84.9 | 83.8 | 81.4 | 78.7 |
Wind speed
The graph below shows the average wind speed.
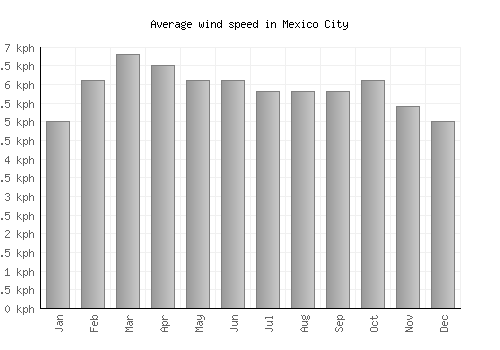
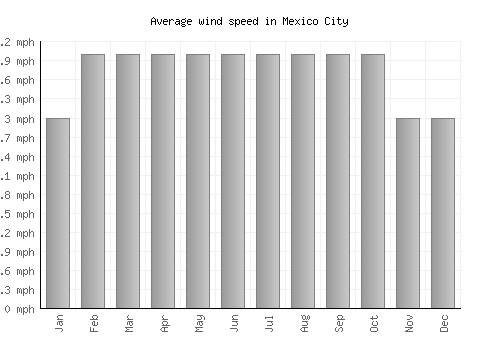
| Jan | Feb | Mar | Apr | May | Jun | Jul | Aug | Sep | Oct | Nov | Dec | |
|---|---|---|---|---|---|---|---|---|---|---|---|---|
| km/h | 5 | 6 | 7 | 7 | 6 | 6 | 6 | 6 | 6 | 6 | 5 | 5 |
| mph | 3 | 4 | 4 | 4 | 4 | 4 | 4 | 4 | 4 | 4 | 3 | 3 |
A monthly average windspeed of over 16km/h or 10mph suggests a location is fairly windy.
Relative humidity
The graph below shows the average relative humidity.
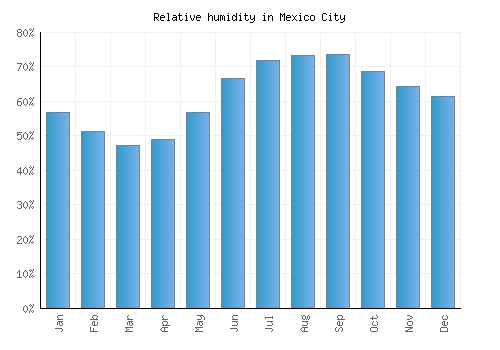
| Jan | Feb | Mar | Apr | May | Jun | Jul | Aug | Sep | Oct | Nov | Dec |
|---|---|---|---|---|---|---|---|---|---|---|---|
| 57% | 51% | 47% | 49% | 57% | 67% | 72% | 73% | 74% | 69% | 64% | 61% |

Other monthly averages
Mexico City weather stats
| Hottest month: | May | 26.5°C 79.7°F |
|---|---|---|
| Driest month: | February | 4mm 0.2ins |
| Sunniest month: | February | 7.4hrs |
| Coldest month: | January | 21.8°C 71.2°F |
| Wettest month: | July | 131mm 5.2ins |
| Warmest sea: | August | 29.6°C 85.3°F |

Locations nearby
Top Mexico locations
- Acapulco
- Cabo San Lucas
- Cancún
- Cozumel
- Guadalajara
- Guanajuato
- Mazatlán
- Mexico City
- Oaxaca de Juárez
- Playa del Carmen
- Puebla
- Puerto Vallarta
- San Miguel de Allende
- Todos Santos
- Zihuatanejo