Brussels monthly weather averages
What's the weather like in Brussels?
Brussels, the capital of Belgium, is located in the temperate climate zone of central Europe. The city has warm summers and cool winters, although temperatures rarely drop below freezing. The average temperature in Brussels is 11°C (51°F) in January and 21°C (70°F) in July.
The city experiences a significant amount of rainfall throughout the year, with an average of 180 days of rain annually. The average annual rainfall is 785mm (31 inches). Snowfall is fairly common during the winter months and can sometimes occur in the spring and autumn months. However, it rarely builds up enough to become an issue.
Brussels is a city that can be enjoyed all year round. The weather can be unpredictable, so it is always a good idea to pack for a variety of conditions. However, with its mild climate and four distinct seasons, Brussels is a city that has something to offer everyone.
Average daytime temperature
The bar chart below shows the average monthly peak daytime temperatures at Brussels
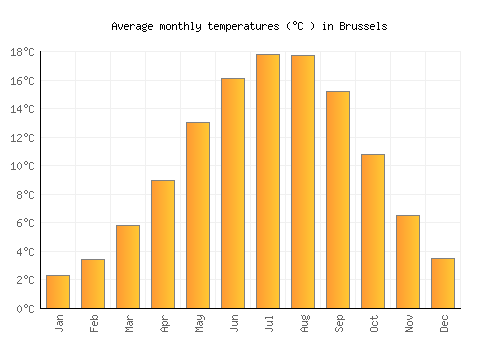
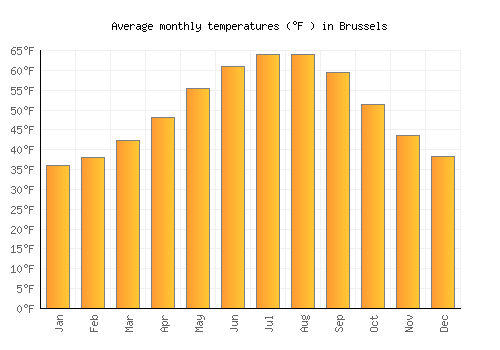
| Jan | Feb | Mar | Apr | May | Jun | Jul | Aug | Sep | Oct | Nov | Dec | |
|---|---|---|---|---|---|---|---|---|---|---|---|---|
| °C | 4.7 | 6.3 | 9.4 | 13.4 | 17.7 | 20.7 | 22.4 | 22.3 | 19.4 | 14.3 | 9.1 | 5.9 |
| °F | 40.5 | 43.3 | 49 | 56.1 | 63.8 | 69.3 | 72.4 | 72.2 | 66.9 | 57.7 | 48.4 | 42.6 |
Please note: these are the average peak daytime temperatures (usually around mid-afternoon) so do not show daytime / night highs and lows. To see the daily range of temperatures have a look at the temperature max / min chart below.
Average rainfall & rainy days
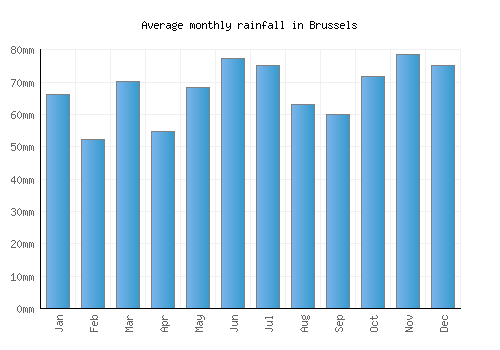
The graph below shows the average rainfall and number of rainy days per month.
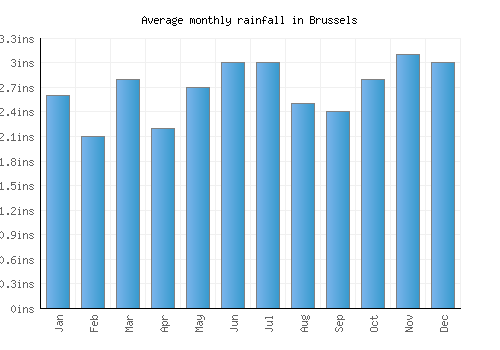
| Jan | Feb | Mar | Apr | May | Jun | Jul | Aug | Sep | Oct | Nov | Dec | |
|---|---|---|---|---|---|---|---|---|---|---|---|---|
| mm | 66 | 52 | 70 | 55 | 69 | 77 | 75 | 63 | 60 | 72 | 79 | 75 |
| inches | 2.6 | 2.1 | 2.8 | 2.2 | 2.7 | 3 | 3 | 2.5 | 2.4 | 2.8 | 3.1 | 3 |
| Rainy days | 18 | 15 | 16 | 15 | 15 | 14 | 16 | 16 | 16 | 19 | 19 | 18 |
Average annual rainfall in Brussels: 868.434mm (341.9 inches)
Average daily sunshine
The bar chart below shows the average daily sunshine hours in Brussels
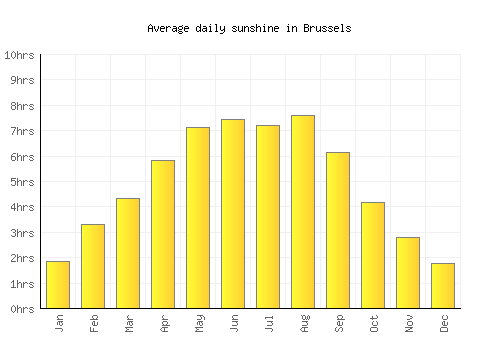
| Jan | Feb | Mar | Apr | May | Jun | Jul | Aug | Sep | Oct | Nov | Dec | |
|---|---|---|---|---|---|---|---|---|---|---|---|---|
| Hrs sunshine | 1.8 | 3.3 | 4.3 | 5.8 | 7.1 | 7.5 | 7.2 | 7.6 | 6.1 | 4.2 | 2.8 | 1.8 |
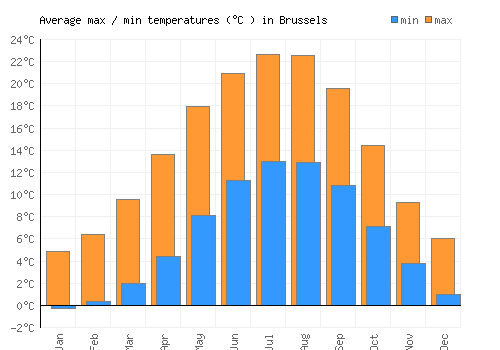
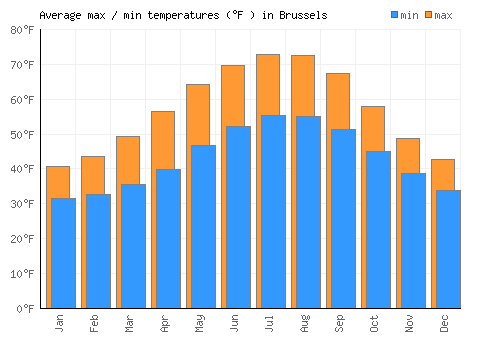
Day / night temperatures
The graph below shows the daily range of temperatures for each month.
| Jan | Feb | Mar | Apr | May | Jun | Jul | Aug | Sep | Oct | Nov | Dec | |
|---|---|---|---|---|---|---|---|---|---|---|---|---|
| Min °C | -0.3 | 0.4 | 2 | 4.4 | 8.1 | 11.3 | 13 | 12.9 | 10.8 | 7.2 | 3.8 | 1 |
| Max °C | 4.9 | 6.4 | 9.6 | 13.6 | 17.9 | 21 | 22.7 | 22.6 | 19.6 | 14.5 | 9.3 | 6 |
| Min °F | 31.6 | 32.7 | 35.6 | 39.9 | 46.6 | 52.3 | 55.3 | 55.1 | 51.4 | 44.9 | 38.8 | 33.8 |
| Max °F | 36.1 | 38.1 | 42.4 | 48.2 | 55.4 | 61 | 64 | 63.9 | 59.4 | 51.4 | 43.7 | 38.3 |
Sea temperature
The graph below shows the average sea temperature.
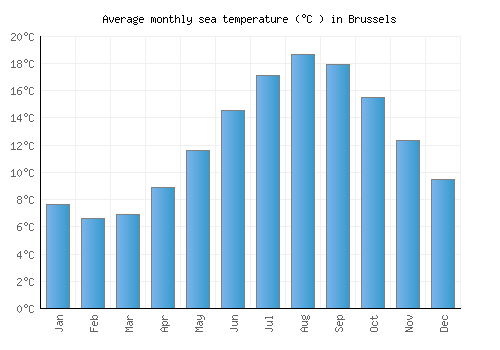
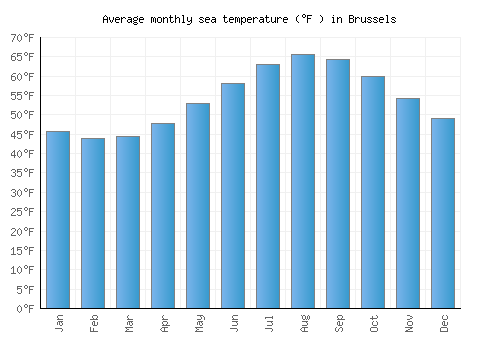
| Jan | Feb | Mar | Apr | May | Jun | Jul | Aug | Sep | Oct | Nov | Dec | |
|---|---|---|---|---|---|---|---|---|---|---|---|---|
| °C | 7.6 | 6.6 | 6.9 | 8.9 | 11.6 | 14.5 | 17.1 | 18.7 | 17.9 | 15.5 | 12.4 | 9.5 |
| °F | 45.7 | 43.9 | 44.5 | 47.9 | 52.9 | 58.2 | 62.9 | 65.6 | 64.2 | 59.9 | 54.3 | 49.1 |
Wind speed
The graph below shows the average wind speed.
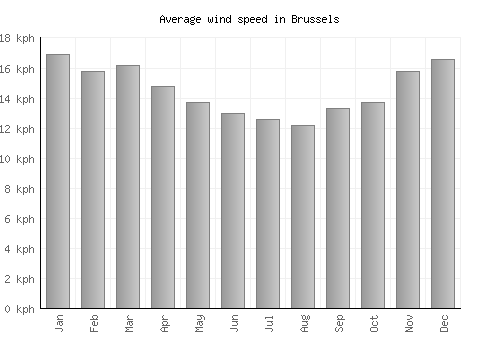
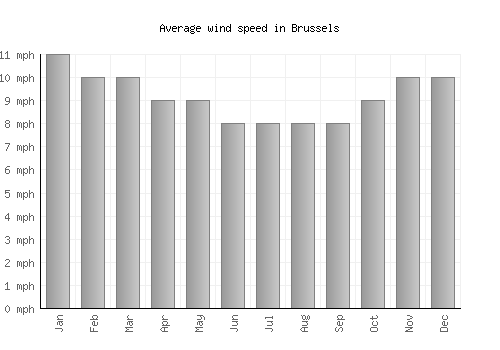
| Jan | Feb | Mar | Apr | May | Jun | Jul | Aug | Sep | Oct | Nov | Dec | |
|---|---|---|---|---|---|---|---|---|---|---|---|---|
| km/h | 17 | 16 | 16 | 15 | 14 | 13 | 13 | 12 | 13 | 14 | 16 | 17 |
| mph | 11 | 10 | 10 | 9 | 9 | 8 | 8 | 8 | 8 | 9 | 10 | 10 |
A monthly average windspeed of over 16km/h or 10mph suggests a location is fairly windy.
Relative humidity
The graph below shows the average relative humidity.
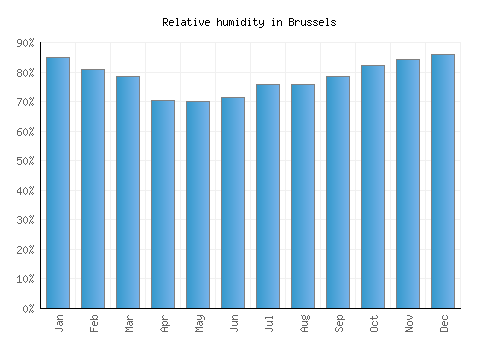
| Jan | Feb | Mar | Apr | May | Jun | Jul | Aug | Sep | Oct | Nov | Dec |
|---|---|---|---|---|---|---|---|---|---|---|---|
| 85% | 81% | 79% | 71% | 70% | 71% | 76% | 76% | 79% | 82% | 84% | 86% |
Other monthly averages
Brussels weather stats
| Hottest month: | July | 22.4°C 72.3°F |
|---|---|---|
| Driest month: | February | 52mm 2ins |
| Sunniest month: | August | 7.6hrs |
| Coldest month: | January | 4.7°C 40.5°F |
| Wettest month: | November | 79mm 3.1ins |
| Warmest sea: | August | 18.7°C 65.7°F |