Reykjavík monthly weather averages
What's the weather like in Reykjavík?
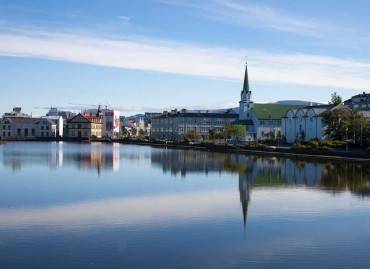
Reykjavik, the capital of Iceland, has what is described as a subpolar oceanic climate. Whilst the city experiences mild temperatures year-round, temperature variations can be quite large due to its northerly location. The coldest months are from December to February, when temperatures often fall below freezing. Summers are relatively mild, with average temperatures ranging from 10 to 13 °C (50 to 55 °F).
Rainfall is quite common in Reykjavik, but snow can be scarce. Snowfall does occur, but usually only during winter months. The city has about 1,600 hours of sunshine per year, with the sunniest periods occurring during the summer months.
The wind is often strong in Reykjavik, with winds of more than 50 kmh (35 mph) not unusual during the winter. The windiest months are usually December and January.
Overall, Reykjavik has a mild climate, with relatively cool summers, mild winters, and frequent wind and rainfall all year round.
Average daytime temperature
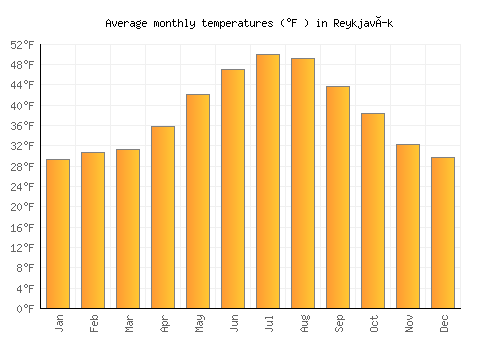
The bar chart below shows the average monthly peak daytime temperatures at Reykjavík
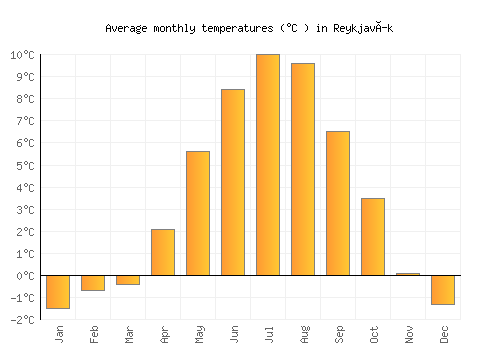
| Jan | Feb | Mar | Apr | May | Jun | Jul | Aug | Sep | Oct | Nov | Dec | |
|---|---|---|---|---|---|---|---|---|---|---|---|---|
| °C | 0.8 | 1.6 | 2.1 | 4.7 | 8.4 | 10.9 | 12.6 | 12.2 | 9 | 5.7 | 2.3 | 1.1 |
| °F | 33.5 | 34.9 | 35.7 | 40.4 | 47.1 | 51.7 | 54.6 | 53.9 | 48.2 | 42.2 | 36.2 | 34 |
Please note: these are the average peak daytime temperatures (usually around mid-afternoon) so do not show daytime / night highs and lows. To see the daily range of temperatures have a look at the temperature max / min chart below.
Average rainfall & rainy days
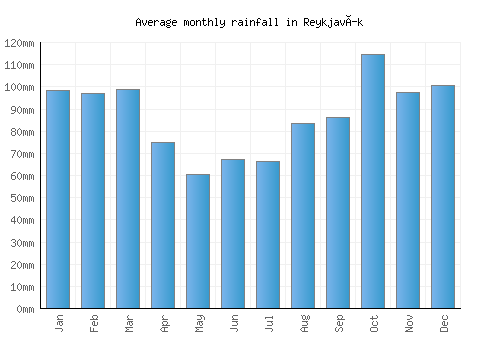
The graph below shows the average rainfall and number of rainy days per month.

| Jan | Feb | Mar | Apr | May | Jun | Jul | Aug | Sep | Oct | Nov | Dec | |
|---|---|---|---|---|---|---|---|---|---|---|---|---|
| mm | 99 | 97 | 99 | 75 | 60 | 67 | 66 | 83 | 86 | 115 | 97 | 100 |
| inches | 3.9 | 3.8 | 3.9 | 2.9 | 2.4 | 2.7 | 2.6 | 3.3 | 3.4 | 4.5 | 3.8 | 4 |
| Rainy days | 18 | 18 | 19 | 18 | 16 | 18 | 18 | 18 | 18 | 20 | 17 | 20 |
Average annual rainfall in Reykjavík: 1087.266mm (428.1 inches)
Average daily sunshine
The bar chart below shows the average daily sunshine hours in Reykjavík
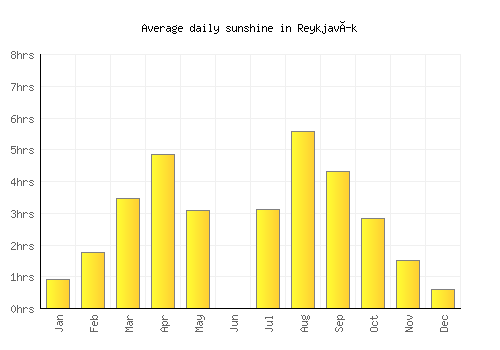
| Jan | Feb | Mar | Apr | May | Jun | Jul | Aug | Sep | Oct | Nov | Dec | |
|---|---|---|---|---|---|---|---|---|---|---|---|---|
| Hrs sunshine | 0.9 | 1.8 | 3.5 | 4.9 | 3.1 | 0 | 3.1 | 5.6 | 4.3 | 2.8 | 1.5 | 0.6 |
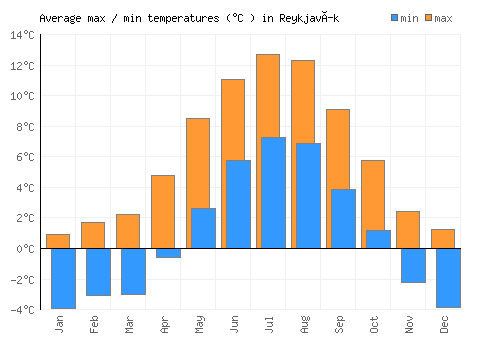
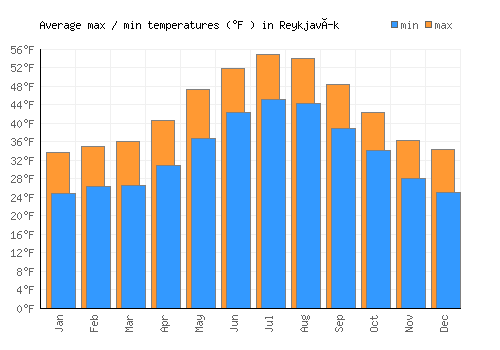
Day / night temperatures
The graph below shows the daily range of temperatures for each month.
| Jan | Feb | Mar | Apr | May | Jun | Jul | Aug | Sep | Oct | Nov | Dec | |
|---|---|---|---|---|---|---|---|---|---|---|---|---|
| Min °C | -4 | -3.1 | -3 | -0.6 | 2.7 | 5.8 | 7.3 | 6.9 | 3.9 | 1.2 | -2.3 | -3.9 |
| Max °C | 1 | 1.7 | 2.2 | 4.8 | 8.6 | 11.1 | 12.7 | 12.3 | 9.1 | 5.8 | 2.5 | 1.3 |
| Min °F | 24.9 | 26.4 | 26.6 | 30.9 | 36.8 | 42.4 | 45.1 | 44.4 | 39 | 34.2 | 28 | 25.1 |
| Max °F | 29.3 | 30.7 | 31.3 | 35.8 | 42.1 | 47.1 | 50 | 49.3 | 43.7 | 38.3 | 32.2 | 29.7 |
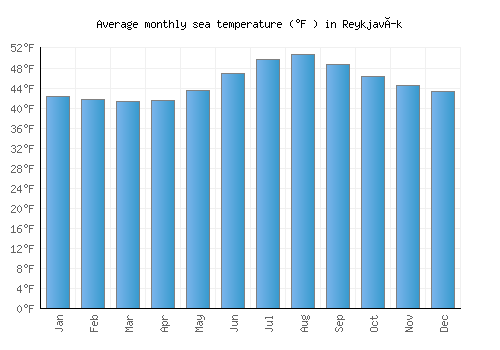
Sea temperature
The graph below shows the average sea temperature.

| Jan | Feb | Mar | Apr | May | Jun | Jul | Aug | Sep | Oct | Nov | Dec | |
|---|---|---|---|---|---|---|---|---|---|---|---|---|
| °C | 5.7 | 5.4 | 5.2 | 5.3 | 6.4 | 8.3 | 9.9 | 10.4 | 9.4 | 8 | 6.9 | 6.3 |
| °F | 42.3 | 41.7 | 41.4 | 41.6 | 43.6 | 47 | 49.8 | 50.7 | 48.8 | 46.4 | 44.5 | 43.3 |
Wind speed
The graph below shows the average wind speed.
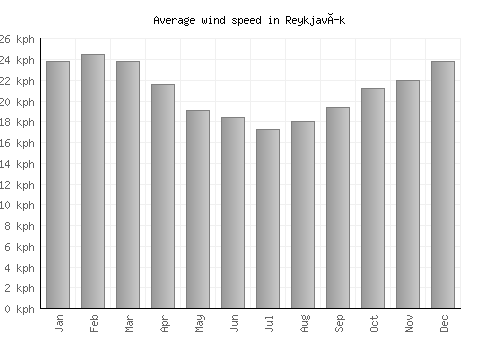
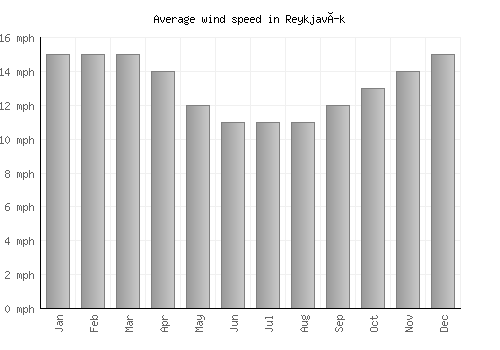
| Jan | Feb | Mar | Apr | May | Jun | Jul | Aug | Sep | Oct | Nov | Dec | |
|---|---|---|---|---|---|---|---|---|---|---|---|---|
| km/h | 24 | 25 | 24 | 22 | 19 | 18 | 17 | 18 | 19 | 21 | 22 | 24 |
| mph | 15 | 15 | 15 | 14 | 12 | 11 | 11 | 11 | 12 | 13 | 14 | 15 |
A monthly average windspeed of over 16km/h or 10mph suggests a location is fairly windy.
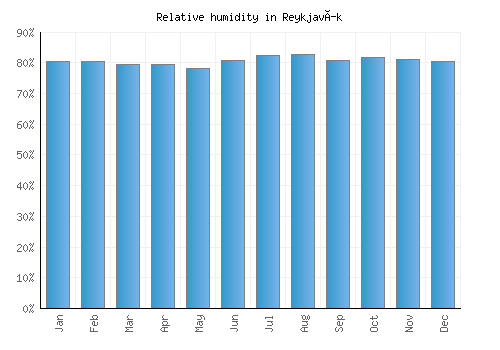
Relative humidity
The graph below shows the average relative humidity.
| Jan | Feb | Mar | Apr | May | Jun | Jul | Aug | Sep | Oct | Nov | Dec |
|---|---|---|---|---|---|---|---|---|---|---|---|
| 80% | 80% | 79% | 80% | 78% | 81% | 82% | 83% | 81% | 82% | 81% | 81% |
Other monthly averages
Reykjavík weather stats
| Hottest month: | July | 12.6°C 54.7°F |
|---|---|---|
| Driest month: | May | 60mm 2.4ins |
| Sunniest month: | May | 3.1hrs |
| Coldest month: | January | 0.8°C 33.4°F |
| Wettest month: | October | 115mm 4.5ins |
| Warmest sea: | August | 10.4°C 50.7°F |