Amsterdam monthly weather averages
What's the weather like in Amsterdam?
The climate of Amsterdam is classified as a humid continental climate, which is typical for the north of Europe. The city experiences relatively warm summers, cold winters, and moderate rainfall throughout the year.
In the summer months from June to August, temperatures usually range from 15 to 25°C (59 to 77°F). During the winter months between December and February, temperatures usually range from 0 to 4°C (32 to 39°F).
Amsterdam experiences an average of 880 mm (34.6 inches) of rain per year, with the wettest months being October to December (averaging around 100 mm per month). Snowfall is fairly common in the winter months, with an average of 8 days of snow per year.
The city also sees its fair share of fog, especially on autumn/fall and wintertime mornings. Amsterdam experiences an average of 7 days of fog per year, with the peak period occurring in December and January.
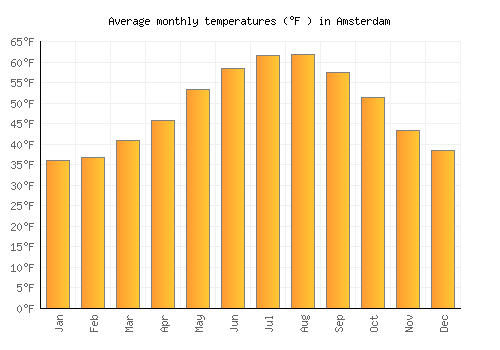
Average daytime temperature
The bar chart below shows the average monthly peak daytime temperatures at Amsterdam
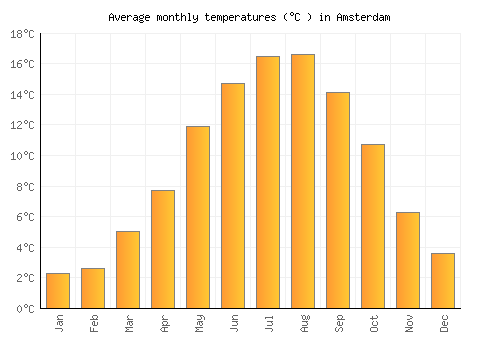
| Jan | Feb | Mar | Apr | May | Jun | Jul | Aug | Sep | Oct | Nov | Dec | |
|---|---|---|---|---|---|---|---|---|---|---|---|---|
| °C | 4.5 | 5.2 | 8.1 | 11.5 | 16 | 18.7 | 20.4 | 20.6 | 17.9 | 14 | 8.9 | 5.8 |
| °F | 40.2 | 41.4 | 46.7 | 52.7 | 60.9 | 65.7 | 68.7 | 69.2 | 64.2 | 57.2 | 48 | 42.5 |
Please note: these are the average peak daytime temperatures (usually around mid-afternoon) so do not show daytime / night highs and lows. To see the daily range of temperatures have a look at the temperature max / min chart below.
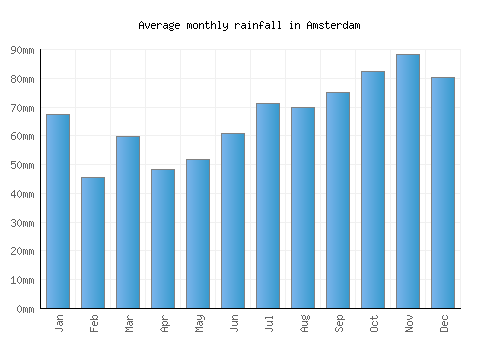
Average rainfall & rainy days
The graph below shows the average rainfall and number of rainy days per month.

| Jan | Feb | Mar | Apr | May | Jun | Jul | Aug | Sep | Oct | Nov | Dec | |
|---|---|---|---|---|---|---|---|---|---|---|---|---|
| mm | 67 | 46 | 60 | 48 | 52 | 61 | 71 | 70 | 75 | 82 | 88 | 80 |
| inches | 2.7 | 1.8 | 2.4 | 1.9 | 2 | 2.4 | 2.8 | 2.8 | 3 | 3.2 | 3.5 | 3.2 |
| Rainy days | 19 | 13 | 18 | 14 | 14 | 14 | 14 | 14 | 16 | 17 | 20 | 19 |
Average annual rainfall in Amsterdam: 858.134mm (337.8 inches)
Average daily sunshine
The bar chart below shows the average daily sunshine hours in Amsterdam
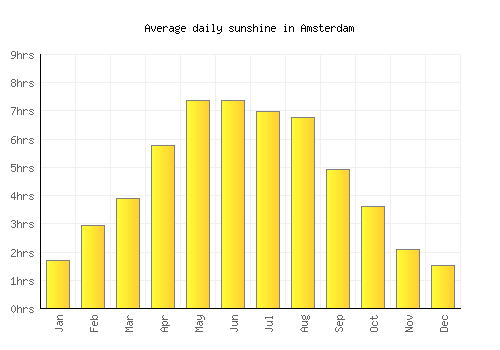
| Jan | Feb | Mar | Apr | May | Jun | Jul | Aug | Sep | Oct | Nov | Dec | |
|---|---|---|---|---|---|---|---|---|---|---|---|---|
| Hrs sunshine | 1.7 | 2.9 | 3.9 | 5.8 | 7.4 | 7.4 | 7 | 6.8 | 4.9 | 3.6 | 2.1 | 1.5 |
Day / night temperatures
The graph below shows the daily range of temperatures for each month.
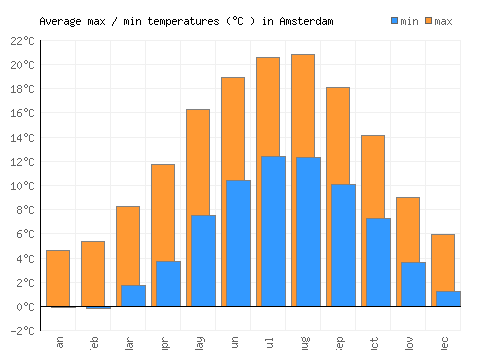
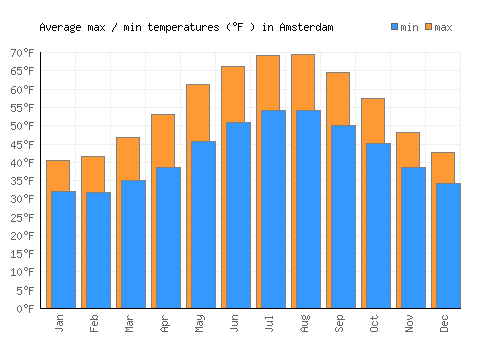
| Jan | Feb | Mar | Apr | May | Jun | Jul | Aug | Sep | Oct | Nov | Dec | |
|---|---|---|---|---|---|---|---|---|---|---|---|---|
| Min °C | -0.1 | -0.2 | 1.7 | 3.7 | 7.6 | 10.5 | 12.4 | 12.4 | 10.1 | 7.3 | 3.6 | 1.3 |
| Max °C | 4.7 | 5.4 | 8.3 | 11.7 | 16.3 | 19 | 20.6 | 20.9 | 18.1 | 14.2 | 9 | 6 |
| Min °F | 31.9 | 31.7 | 35.1 | 38.7 | 45.6 | 50.8 | 54.3 | 54.2 | 50.2 | 45.1 | 38.5 | 34.3 |
| Max °F | 36.1 | 36.7 | 41 | 45.9 | 53.4 | 58.5 | 61.7 | 61.9 | 57.4 | 51.3 | 43.3 | 38.5 |
Sea temperature
The graph below shows the average sea temperature.
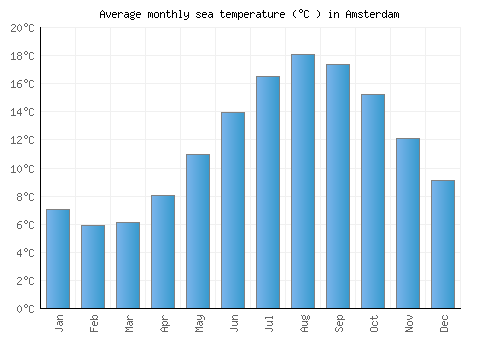
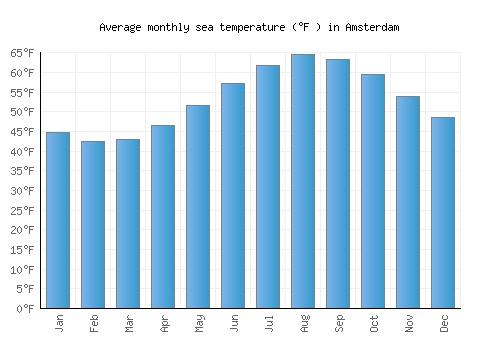
| Jan | Feb | Mar | Apr | May | Jun | Jul | Aug | Sep | Oct | Nov | Dec | |
|---|---|---|---|---|---|---|---|---|---|---|---|---|
| °C | 7.1 | 5.9 | 6.1 | 8.1 | 11 | 14 | 16.5 | 18.1 | 17.4 | 15.2 | 12.1 | 9.1 |
| °F | 44.7 | 42.6 | 43 | 46.5 | 51.7 | 57.1 | 61.8 | 64.6 | 63.3 | 59.4 | 53.8 | 48.5 |
Wind speed
The graph below shows the average wind speed.
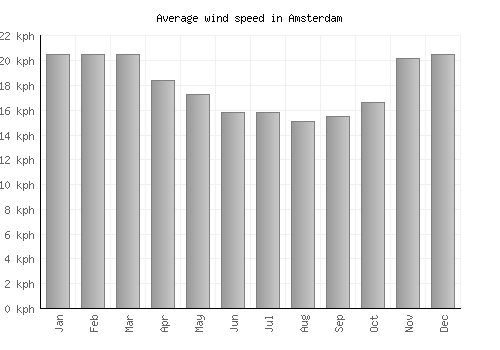
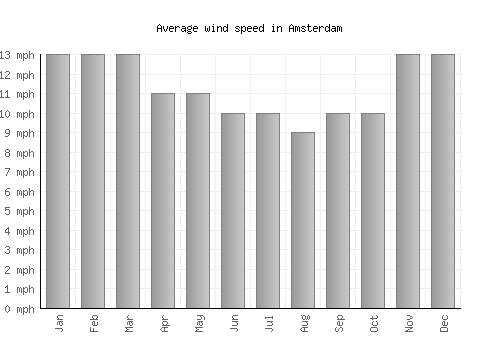
| Jan | Feb | Mar | Apr | May | Jun | Jul | Aug | Sep | Oct | Nov | Dec | |
|---|---|---|---|---|---|---|---|---|---|---|---|---|
| km/h | 21 | 21 | 21 | 18 | 17 | 16 | 16 | 15 | 16 | 17 | 20 | 21 |
| mph | 13 | 13 | 13 | 11 | 11 | 10 | 10 | 9 | 10 | 10 | 13 | 13 |
A monthly average windspeed of over 16km/h or 10mph suggests a location is fairly windy.
Relative humidity
The graph below shows the average relative humidity.
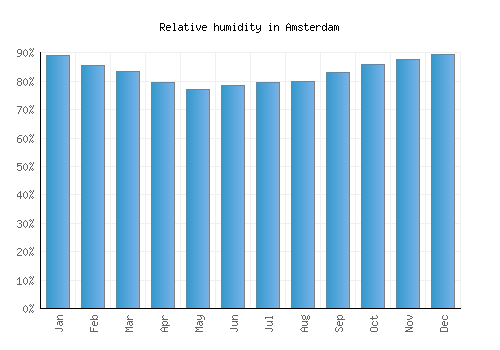
| Jan | Feb | Mar | Apr | May | Jun | Jul | Aug | Sep | Oct | Nov | Dec |
|---|---|---|---|---|---|---|---|---|---|---|---|
| 89% | 86% | 84% | 80% | 77% | 79% | 80% | 80% | 83% | 86% | 88% | 89% |

Other monthly averages
Amsterdam weather stats
| Hottest month: | August | 20.6°C 69.1°F |
|---|---|---|
| Driest month: | February | 46mm 1.8ins |
| Sunniest month: | May | 7.4hrs |
| Coldest month: | January | 4.5°C 40.1°F |
| Wettest month: | November | 88mm 3.5ins |
| Warmest sea: | August | 18.1°C 64.6°F |