Kraków monthly weather averages
Average daytime temperature
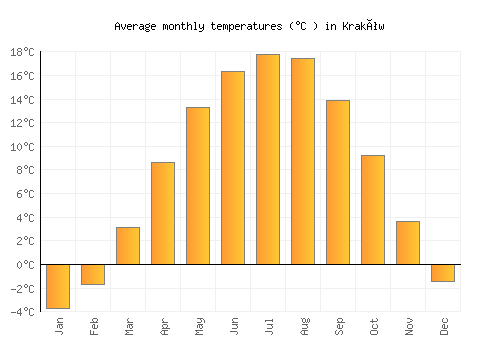
The bar chart below shows the average monthly peak daytime temperatures at Kraków
| Jan | Feb | Mar | Apr | May | Jun | Jul | Aug | Sep | Oct | Nov | Dec | |
|---|---|---|---|---|---|---|---|---|---|---|---|---|
| °C | -0.5 | 1.6 | 7.1 | 13.6 | 18.6 | 21.4 | 23 | 22.7 | 18.8 | 13.8 | 6.7 | 1.4 |
| °F | 31.1 | 34.9 | 44.9 | 56.5 | 65.5 | 70.6 | 73.4 | 72.8 | 65.8 | 56.8 | 44.1 | 34.5 |
Please note: these are the average peak daytime temperatures (usually around mid-afternoon) so do not show daytime / night highs and lows. To see the daily range of temperatures have a look at the temperature max / min chart below.
Average rainfall & rainy days
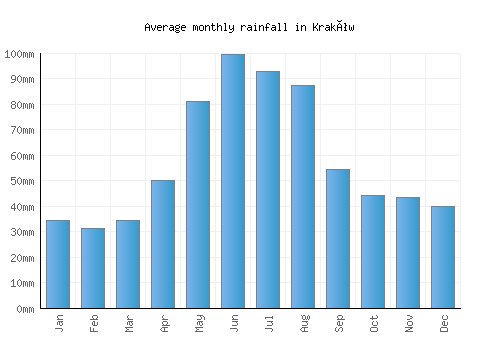
The graph below shows the average rainfall and number of rainy days per month.
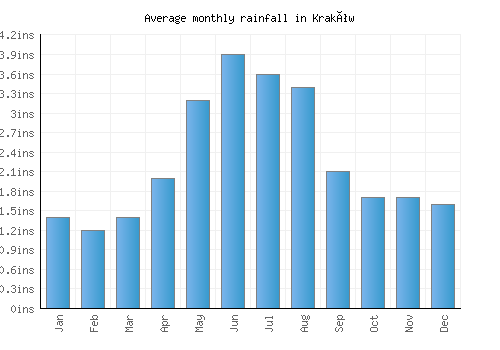
| Jan | Feb | Mar | Apr | May | Jun | Jul | Aug | Sep | Oct | Nov | Dec | |
|---|---|---|---|---|---|---|---|---|---|---|---|---|
| mm | 35 | 31 | 34 | 50 | 81 | 100 | 93 | 88 | 54 | 44 | 43 | 40 |
| inches | 1.4 | 1.2 | 1.4 | 2 | 3.2 | 3.9 | 3.6 | 3.4 | 2.1 | 1.7 | 1.7 | 1.6 |
| Rainy days | 16 | 14 | 14 | 13 | 14 | 15 | 14 | 13 | 12 | 12 | 16 | 17 |
Average annual rainfall in Kraków: 763.1mm (300.4 inches)
Average daily sunshine
The bar chart below shows the average daily sunshine hours in Kraków
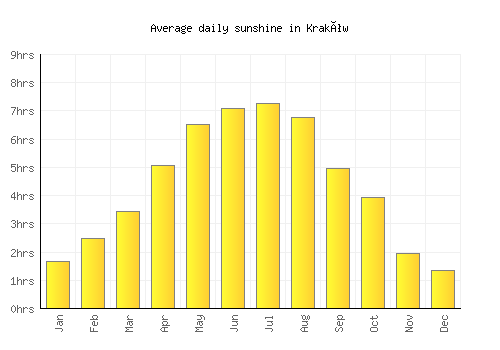
| Jan | Feb | Mar | Apr | May | Jun | Jul | Aug | Sep | Oct | Nov | Dec | |
|---|---|---|---|---|---|---|---|---|---|---|---|---|
| Hrs sunshine | 1.7 | 2.5 | 3.5 | 5.1 | 6.5 | 7.1 | 7.3 | 6.8 | 5 | 3.9 | 2 | 1.4 |
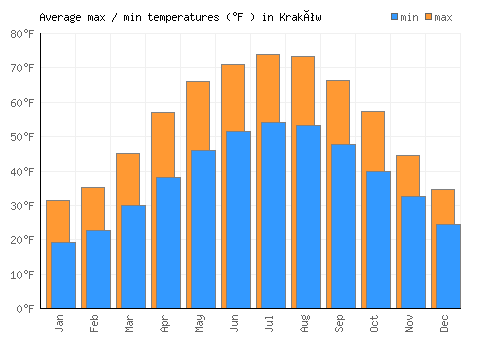
Day / night temperatures
The graph below shows the daily range of temperatures for each month.
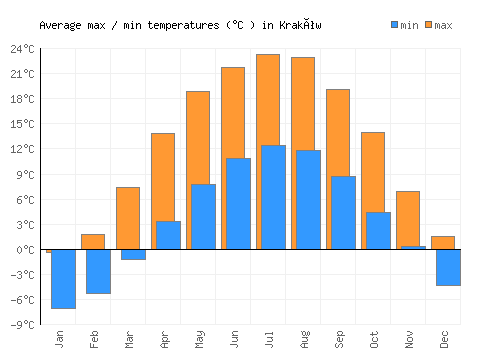
| Jan | Feb | Mar | Apr | May | Jun | Jul | Aug | Sep | Oct | Nov | Dec | |
|---|---|---|---|---|---|---|---|---|---|---|---|---|
| Min °C | -7.1 | -5.2 | -1.2 | 3.4 | 7.8 | 10.9 | 12.4 | 11.9 | 8.8 | 4.4 | 0.3 | -4.3 |
| Max °C | -0.4 | 1.8 | 7.4 | 13.9 | 18.9 | 21.7 | 23.3 | 23 | 19.1 | 14 | 6.9 | 1.5 |
| Min °F | 19.3 | 22.6 | 29.9 | 38 | 46 | 51.6 | 54.2 | 53.3 | 47.8 | 39.9 | 32.5 | 24.3 |
| Max °F | 25.3 | 28.9 | 37.6 | 47.5 | 55.9 | 61.3 | 64 | 63.3 | 57 | 48.6 | 38.5 | 29.5 |
Sea temperature
The graph below shows the average sea temperature.
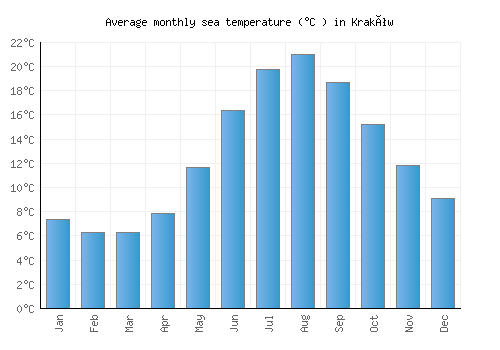
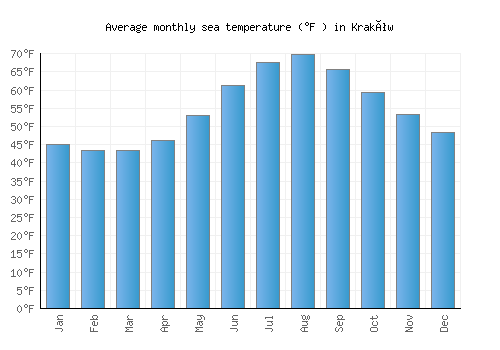
| Jan | Feb | Mar | Apr | May | Jun | Jul | Aug | Sep | Oct | Nov | Dec | |
|---|---|---|---|---|---|---|---|---|---|---|---|---|
| °C | 7.3 | 6.3 | 6.3 | 7.8 | 11.6 | 16.3 | 19.8 | 21 | 18.7 | 15.2 | 11.8 | 9.1 |
| °F | 45.2 | 43.3 | 43.4 | 46.1 | 52.9 | 61.4 | 67.6 | 69.8 | 65.7 | 59.4 | 53.2 | 48.3 |
Wind speed
The graph below shows the average wind speed.
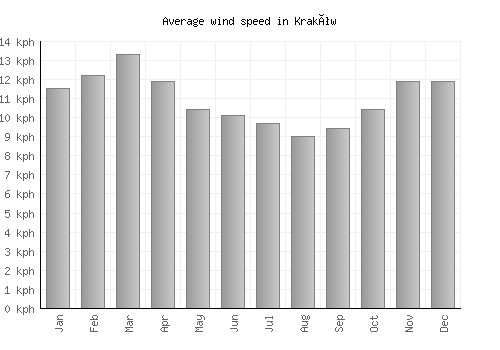
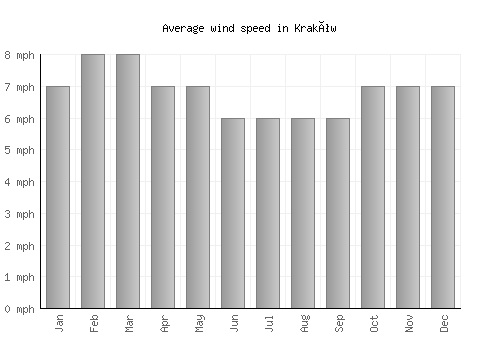
| Jan | Feb | Mar | Apr | May | Jun | Jul | Aug | Sep | Oct | Nov | Dec | |
|---|---|---|---|---|---|---|---|---|---|---|---|---|
| km/h | 12 | 12 | 13 | 12 | 10 | 10 | 10 | 9 | 9 | 10 | 12 | 12 |
| mph | 7 | 8 | 8 | 7 | 7 | 6 | 6 | 6 | 6 | 7 | 7 | 7 |
A monthly average windspeed of over 16km/h or 10mph suggests a location is fairly windy.
Relative humidity
The graph below shows the average relative humidity.
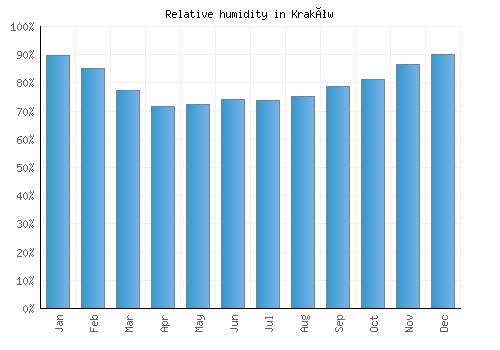
| Jan | Feb | Mar | Apr | May | Jun | Jul | Aug | Sep | Oct | Nov | Dec |
|---|---|---|---|---|---|---|---|---|---|---|---|
| 90% | 85% | 77% | 72% | 73% | 74% | 74% | 75% | 79% | 81% | 87% | 90% |

Other monthly averages
Kraków weather stats
| Hottest month: | July | 23°C 73.4°F |
|---|---|---|
| Driest month: | February | 31mm 1.2ins |
| Sunniest month: | August | 6.8hrs |
| Coldest month: | January | -0.5°C 31.1°F |
| Wettest month: | June | 100mm 3.9ins |
| Warmest sea: | August | 21°C 69.8°F |