Hayling Island Weather in November
What's the weather like in Hayling Island (England) in November 2025?
The climate in Hayling Island during November can be summarized as cool and a little damp.
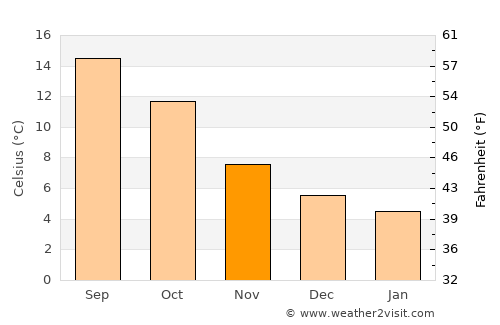
November is in the fall / autumn in Hayling Island and is typically the 5th coldest month of the year. Daytime maximum temperatures average around a cool 11°C (51°F), whilst at night 5°C (41°F) is normal.
| Daytime temperature | 10.5°C 50.8°F |
|---|---|
| Nightly temperature | 4.8°C 40.6°F |
| Average temperature | 7.6°C 45.7°F |
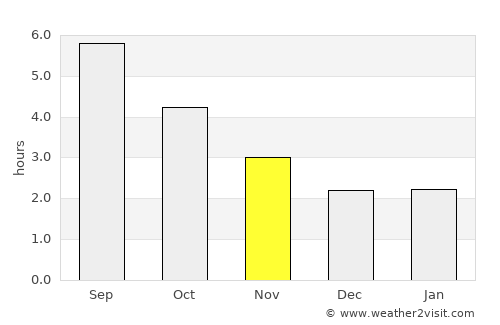
| Daily sunshine | 3 hrs |
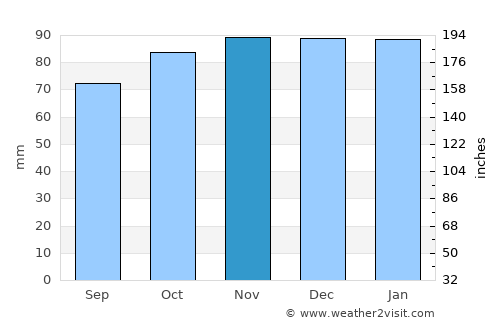
| Avg rainfall | 89 mm 3.5 ins |
| Rainy days | 15 days |
| Sea temperature | 13.6°C 56.4°F |
| Humidity | 91% |
| Windspeed | 15.6kph 10 mph |
On average November is the wettest month of the year in Hayling Island with around 89mm 3.5 inches of rain making it a a little damp time to visit. This rainfall is typically spread over 15 days, although this may vary considerably.
On the flip side this corresponds to an average of 3 hours of sunshine per day.
November temperatures in Hayling Island
November rainfall
November hourly sunshine
The data used in these monthly averages covers a period of over 100 years right up until last year. As such they are a valid prediction of what to expect for the weather in Hayling Island in November 2025.
Other monthly averages
Best places to visit in November
Hayling Island weather stats
| Hottest month: | July | 20.4°C 68.7°F |
|---|---|---|
| Driest month: | July | 46mm 1.8ins |
| Sunniest month: | August | 7.3hrs |
| Coldest month: | February | 7°C 44.6°F |
| Wettest month: | November | 89mm 3.5ins |

Locations nearby
Top United Kingdom locations
- Belfast
- Birmingham
- Blackpool
- Bournemouth
- Brighton
- Cardiff
- Edinburgh
- Glasgow
- Liverpool
- London
- Manchester
- Newquay
- Oxford
- St Ives
- Swansea
- Torquay
- Weymouth
- Windsor
- York