Mecca monthly weather averages
What's the weather like in Mecca?
Mecca, Saudi Arabia has a hot desert climate meaning extremely hot, dry, sunny summers and mild winters. The climate in Mecca can be very challenging, especially in the summer. During the summer months, temperatures can reach up to 40°C (104°F) and are often accompanied by high humidity levels. The intense heat and humidity can sometimes be unbearable, and it is not uncommon for temperatures to nudge 50°C (122°F).
Such intense heat can make it difficult to stay cool so it is important to drink plenty of fluids and avoid strenuous activity during the hottest part of the day.
During the winter months, temperatures drop noticeably, and rainfall is more common. The coldest month is January, with an average temperature of 21.3 °C (70.4 °F).
In General Mecca receives very little rainfall, with an average annual rainfall of 130 mm (5.1 in). The majority of the rainfall occurs in the winter months, between November and January.
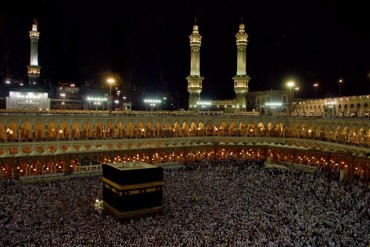
Mecca is considered to be one of the holiest cities in the Islamic faith, and serves as the birthplace of the Prophet Muhammad and the site of the Kaaba, the holiest shrine in Islam. As a result, the city is an important pilgrimage destination for millions of Muslims around the world. Those visiting should prepare for extreme heat and long days so as to avoid dehydration and heat exhaustion.
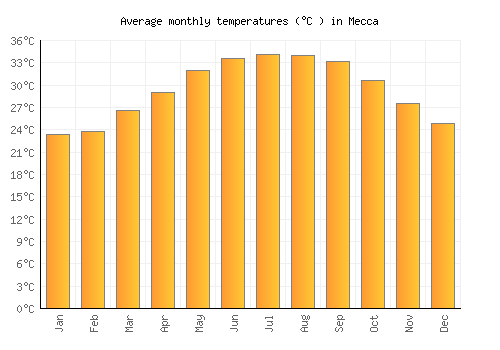
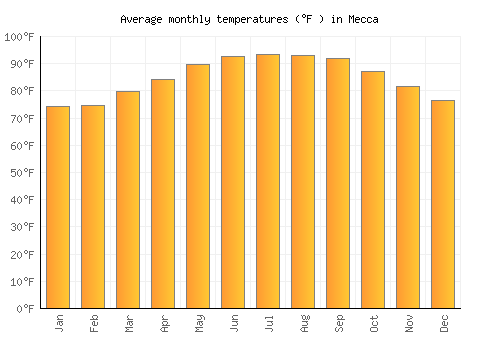
Average daytime temperature
The bar chart below shows the average monthly peak daytime temperatures at Mecca
| Jan | Feb | Mar | Apr | May | Jun | Jul | Aug | Sep | Oct | Nov | Dec | |
|---|---|---|---|---|---|---|---|---|---|---|---|---|
| °C | 28.6 | 29.6 | 32.7 | 35.3 | 38.4 | 40.3 | 40.3 | 39.9 | 39.3 | 36.8 | 33.1 | 30.2 |
| °F | 83.5 | 85.3 | 90.9 | 95.5 | 101.1 | 104.6 | 104.5 | 103.8 | 102.7 | 98.3 | 91.6 | 86.3 |
Please note: these are the average peak daytime temperatures (usually around mid-afternoon) so do not show daytime / night highs and lows. To see the daily range of temperatures have a look at the temperature max / min chart below.
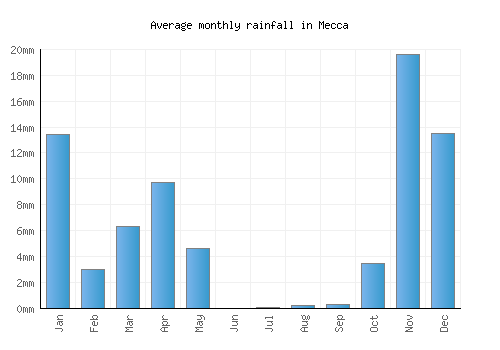
Average rainfall & rainy days
The graph below shows the average rainfall and number of rainy days per month.
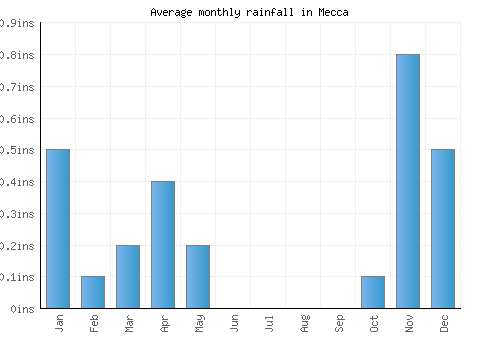
| Jan | Feb | Mar | Apr | May | Jun | Jul | Aug | Sep | Oct | Nov | Dec | |
|---|---|---|---|---|---|---|---|---|---|---|---|---|
| mm | 13 | 3 | 6 | 10 | 5 | 0 | 0 | 0 | 0 | 4 | 20 | 14 |
| inches | 0.5 | 0.1 | 0.2 | 0.4 | 0.2 | 0 | 0 | 0 | 0 | 0.1 | 0.8 | 0.5 |
| Rainy days | 2 | 0 | 1 | 2 | 2 | 0 | 0 | 0 | 0 | 1 | 2 | 1 |
Average annual rainfall in Mecca: 135.367mm (53.3 inches)
Average daily sunshine
The bar chart below shows the average daily sunshine hours in Mecca
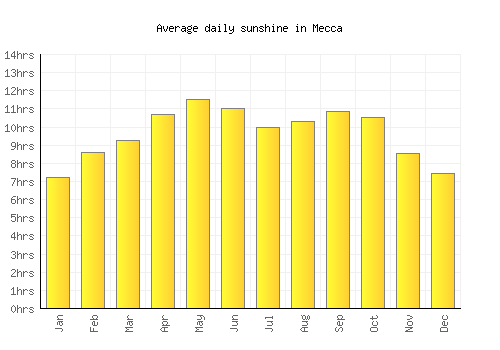
| Jan | Feb | Mar | Apr | May | Jun | Jul | Aug | Sep | Oct | Nov | Dec | |
|---|---|---|---|---|---|---|---|---|---|---|---|---|
| Hrs sunshine | 7.2 | 8.6 | 9.3 | 10.7 | 11.5 | 11 | 10 | 10.3 | 10.8 | 10.5 | 8.5 | 7.4 |
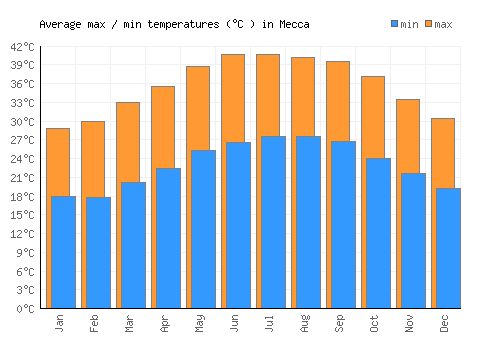
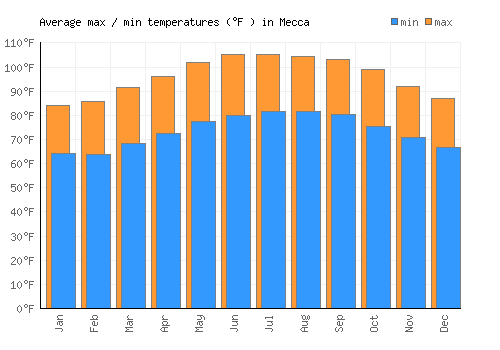
Day / night temperatures
The graph below shows the daily range of temperatures for each month.
| Jan | Feb | Mar | Apr | May | Jun | Jul | Aug | Sep | Oct | Nov | Dec | |
|---|---|---|---|---|---|---|---|---|---|---|---|---|
| Min °C | 18 | 17.7 | 20.2 | 22.4 | 25.3 | 26.6 | 27.6 | 27.6 | 26.8 | 24.1 | 21.6 | 19.2 |
| Max °C | 28.9 | 29.9 | 33 | 35.6 | 38.7 | 40.7 | 40.6 | 40.2 | 39.6 | 37.2 | 33.4 | 30.5 |
| Min °F | 64.3 | 63.9 | 68.4 | 72.3 | 77.5 | 79.8 | 81.7 | 81.7 | 80.2 | 75.3 | 70.9 | 66.5 |
| Max °F | 74.1 | 74.8 | 79.9 | 84.2 | 89.6 | 92.5 | 93.4 | 93 | 91.8 | 87.1 | 81.5 | 76.6 |
Sea temperature
The graph below shows the average sea temperature.
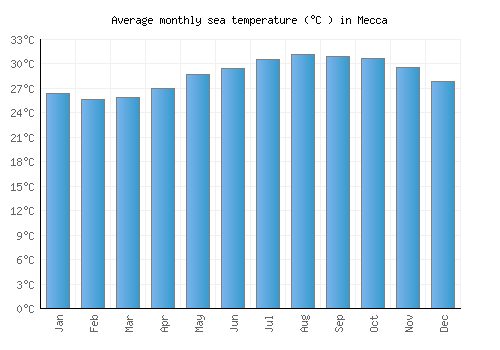
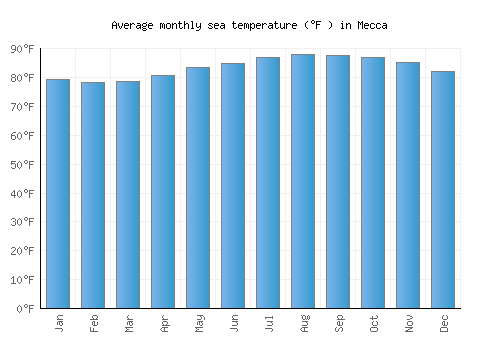
| Jan | Feb | Mar | Apr | May | Jun | Jul | Aug | Sep | Oct | Nov | Dec | |
|---|---|---|---|---|---|---|---|---|---|---|---|---|
| °C | 26.3 | 25.6 | 25.8 | 27 | 28.6 | 29.4 | 30.6 | 31.1 | 30.9 | 30.6 | 29.5 | 27.9 |
| °F | 79.4 | 78.2 | 78.5 | 80.6 | 83.5 | 84.9 | 87 | 88 | 87.6 | 87.1 | 85.2 | 82.2 |
Wind speed
The graph below shows the average wind speed.
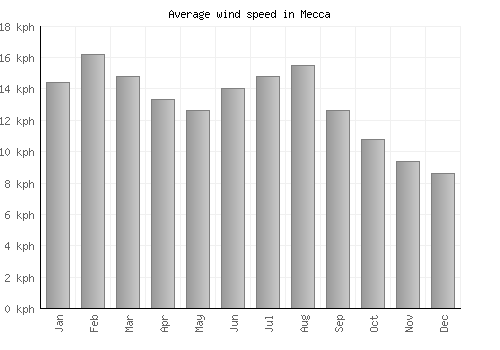

| Jan | Feb | Mar | Apr | May | Jun | Jul | Aug | Sep | Oct | Nov | Dec | |
|---|---|---|---|---|---|---|---|---|---|---|---|---|
| km/h | 14 | 16 | 15 | 13 | 13 | 14 | 15 | 16 | 13 | 11 | 9 | 9 |
| mph | 9 | 10 | 9 | 8 | 8 | 9 | 9 | 10 | 8 | 7 | 6 | 5 |
A monthly average windspeed of over 16km/h or 10mph suggests a location is fairly windy.
Relative humidity
The graph below shows the average relative humidity.
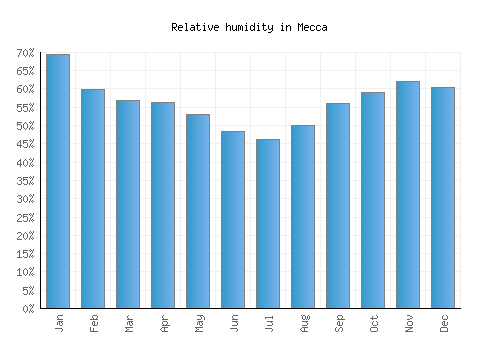
| Jan | Feb | Mar | Apr | May | Jun | Jul | Aug | Sep | Oct | Nov | Dec |
|---|---|---|---|---|---|---|---|---|---|---|---|
| 69% | 60% | 57% | 56% | 53% | 48% | 46% | 50% | 56% | 59% | 62% | 60% |
Other monthly averages
Mecca weather stats
| Hottest month: | July | 40.3°C 104.5°F |
|---|---|---|
| Driest month: | June | 0mm 0ins |
| Sunniest month: | October | 10.5hrs |
| Coldest month: | January | 28.6°C 83.5°F |
| Wettest month: | November | 20mm 0.8ins |
| Warmest sea: | August | 31.1°C 88°F |