Dubai monthly weather averages
What's the weather like in Dubai?
Dubai has a hot desert climate, with very hot summers and mild winters. Although the city receives very little rain throughout the year, the humidity is high, typically ranging from 70-90% throughout the year. This can make the heat feel quite oppressive during the summer months.
The summer months (June-August) are the hottest and most humid, with temperatures reaching up to 40 degrees Celsius (104 degrees Fahrenheit). The winter months (December-February) are the coolest and driest, with temperatures ranging from 15-25 degrees Celsius (59-77 degrees Fahrenheit).
Rainfall is very rare in Dubai, with an average of only around 50mm (2 inches) of rain per year. Most of this falls in the winter months, with the summer months being virtually rain-free.
The hot climate and lack of rainfall make Dubai an ideal destination for sun-seekers and beach lovers. With its year-round sunshine and stunning beaches, Dubai is the perfect place to soak up some rays and enjoy the warm weather.
The best time to visit Dubai is during the shoulder seasons (March-May and September-November), when the weather is still warm but not as hot as in the summer, and the humidity is not as high.
Average daytime temperature
The bar chart below shows the average monthly peak daytime temperatures at Dubai
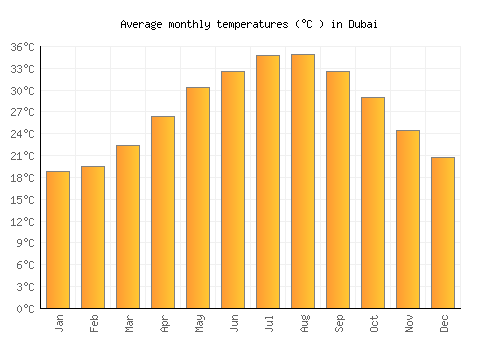
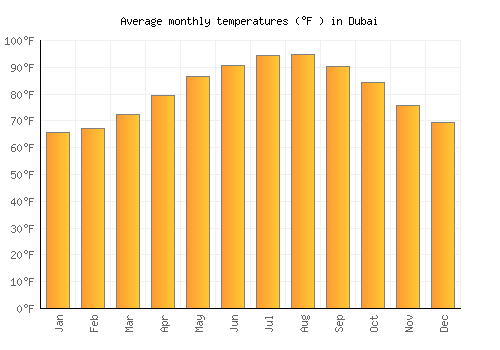
| Jan | Feb | Mar | Apr | May | Jun | Jul | Aug | Sep | Oct | Nov | Dec | |
|---|---|---|---|---|---|---|---|---|---|---|---|---|
| °C | 23.8 | 24.5 | 27.8 | 32.5 | 36.8 | 38.8 | 40.5 | 40.3 | 38.5 | 35.1 | 30.3 | 25.9 |
| °F | 74.9 | 76 | 82 | 90.5 | 98.3 | 101.9 | 104.9 | 104.6 | 101.4 | 95.3 | 86.5 | 78.6 |
Please note: these are the average peak daytime temperatures (usually around mid-afternoon) so do not show daytime / night highs and lows. To see the daily range of temperatures have a look at the temperature max / min chart below.
Average rainfall & rainy days
The graph below shows the average rainfall and number of rainy days per month.
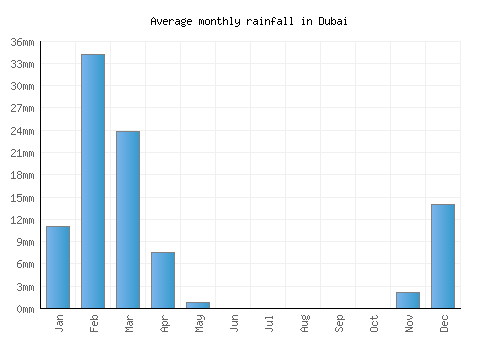
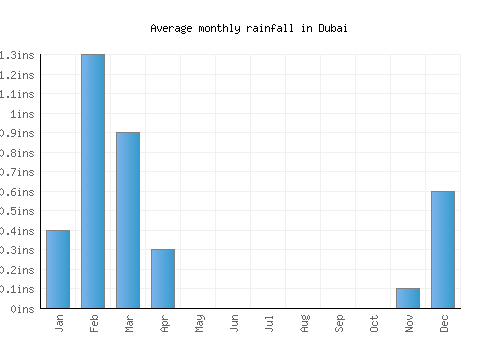
| Jan | Feb | Mar | Apr | May | Jun | Jul | Aug | Sep | Oct | Nov | Dec | |
|---|---|---|---|---|---|---|---|---|---|---|---|---|
| mm | 11 | 34 | 24 | 8 | 1 | 0 | 0 | 0 | 0 | 0 | 2 | 14 |
| inches | 0.4 | 1.3 | 0.9 | 0.3 | 0 | 0 | 0 | 0 | 0 | 0 | 0.1 | 0.6 |
| Rainy days | 2 | 4 | 4 | 2 | 0 | 0 | 0 | 0 | 0 | 0 | 0 | 2 |
Average annual rainfall in Dubai: 173.9mm (68.5 inches)
Average daily sunshine
The bar chart below shows the average daily sunshine hours in Dubai
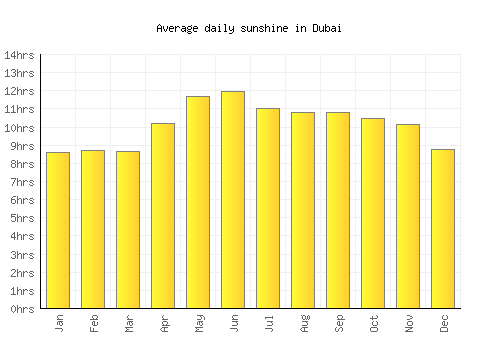
| Jan | Feb | Mar | Apr | May | Jun | Jul | Aug | Sep | Oct | Nov | Dec | |
|---|---|---|---|---|---|---|---|---|---|---|---|---|
| Hrs sunshine | 8.6 | 8.7 | 8.7 | 10.2 | 11.7 | 12 | 11 | 10.8 | 10.8 | 10.5 | 10.1 | 8.8 |
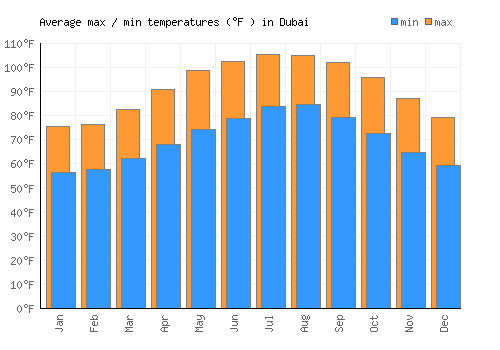
Day / night temperatures
The graph below shows the daily range of temperatures for each month.
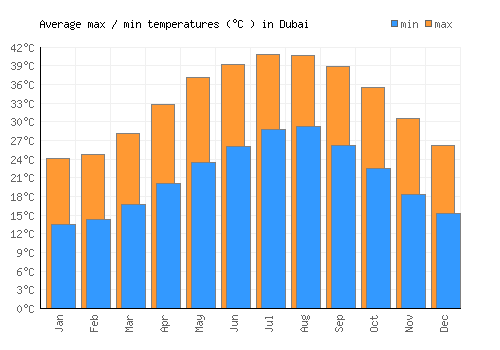
| Jan | Feb | Mar | Apr | May | Jun | Jul | Aug | Sep | Oct | Nov | Dec | |
|---|---|---|---|---|---|---|---|---|---|---|---|---|
| Min °C | 13.5 | 14.3 | 16.8 | 20 | 23.5 | 26.1 | 28.8 | 29.2 | 26.2 | 22.6 | 18.3 | 15.3 |
| Max °C | 24.1 | 24.7 | 28.1 | 32.8 | 37.2 | 39.2 | 40.8 | 40.6 | 38.9 | 35.5 | 30.6 | 26.2 |
| Min °F | 56.3 | 57.7 | 62.2 | 68 | 74.2 | 78.9 | 83.8 | 84.6 | 79.1 | 72.6 | 64.9 | 59.5 |
| Max °F | 65.8 | 67.1 | 72.3 | 79.5 | 86.5 | 90.7 | 94.6 | 94.8 | 90.5 | 84.2 | 75.9 | 69.3 |
Sea temperature
The graph below shows the average sea temperature.
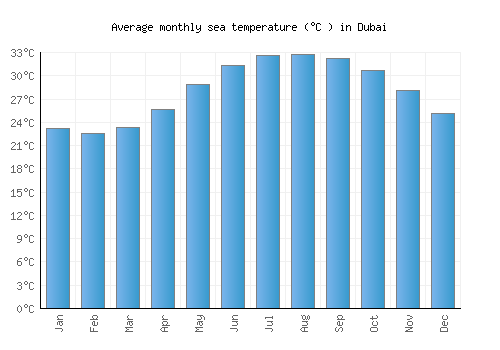
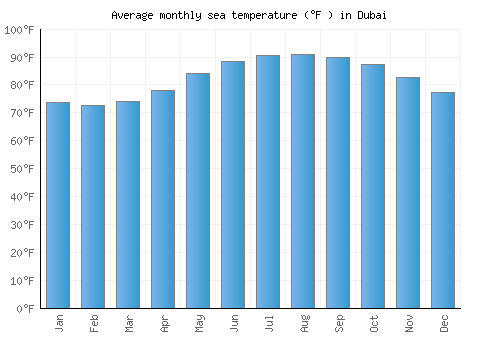
| Jan | Feb | Mar | Apr | May | Jun | Jul | Aug | Sep | Oct | Nov | Dec | |
|---|---|---|---|---|---|---|---|---|---|---|---|---|
| °C | 23.2 | 22.5 | 23.3 | 25.6 | 28.9 | 31.3 | 32.6 | 32.7 | 32.2 | 30.7 | 28.2 | 25.1 |
| °F | 73.7 | 72.6 | 74 | 78.1 | 84 | 88.4 | 90.6 | 90.9 | 89.9 | 87.3 | 82.7 | 77.3 |
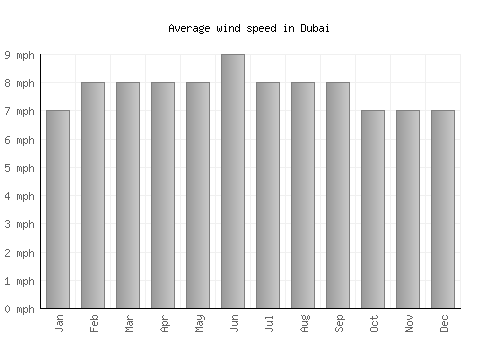
Wind speed
The graph below shows the average wind speed.
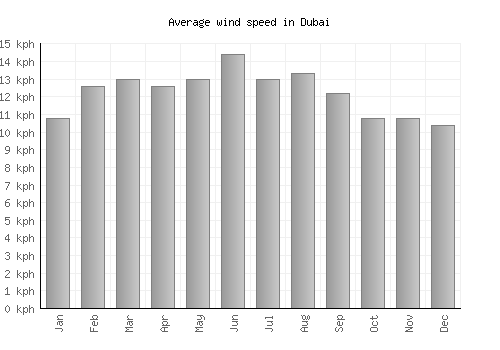
| Jan | Feb | Mar | Apr | May | Jun | Jul | Aug | Sep | Oct | Nov | Dec | |
|---|---|---|---|---|---|---|---|---|---|---|---|---|
| km/h | 11 | 13 | 13 | 13 | 13 | 14 | 13 | 13 | 12 | 11 | 11 | 10 |
| mph | 7 | 8 | 8 | 8 | 8 | 9 | 8 | 8 | 8 | 7 | 7 | 7 |
A monthly average windspeed of over 16km/h or 10mph suggests a location is fairly windy.
Relative humidity
The graph below shows the average relative humidity.
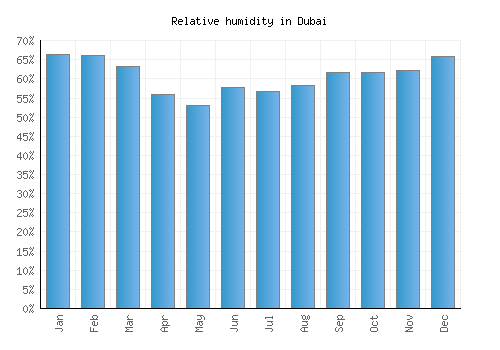
| Jan | Feb | Mar | Apr | May | Jun | Jul | Aug | Sep | Oct | Nov | Dec |
|---|---|---|---|---|---|---|---|---|---|---|---|
| 66% | 66% | 63% | 56% | 53% | 58% | 57% | 58% | 62% | 62% | 62% | 66% |

Other monthly averages
Dubai weather stats
| Hottest month: | August | 40.3°C 104.5°F |
|---|---|---|
| Driest month: | June | 0mm 0ins |
| Sunniest month: | November | 10.1hrs |
| Coldest month: | January | 23.8°C 74.8°F |
| Wettest month: | February | 34mm 1.3ins |
| Warmest sea: | August | 32.7°C 90.9°F |