Macamic Weather in October
What's the weather like in Macamic (Quebec) in October 2025?
The climate in Macamic during October can be summarized as cool and a little damp.
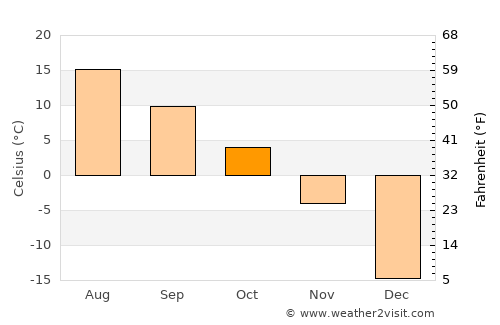
October is in the fall / autumn in Macamic and is typically the 6th warmest month of the year. Daytime maximum temperatures average around a cold 8°C (47°F), whilst at night -0°C (31°F) is normal.
| Daytime temperature | 8.4°C 47.1°F |
|---|---|
| Nightly temperature | -0.4°C 31.3°F |
| Average temperature | 4°C 39.2°F |
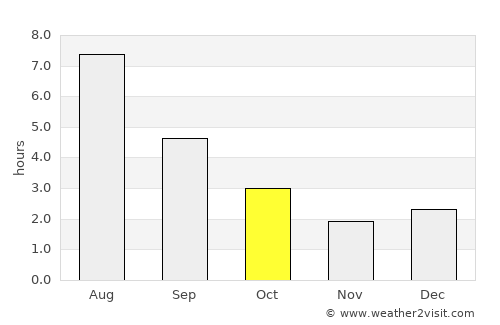
| Daily sunshine | 3 hrs |
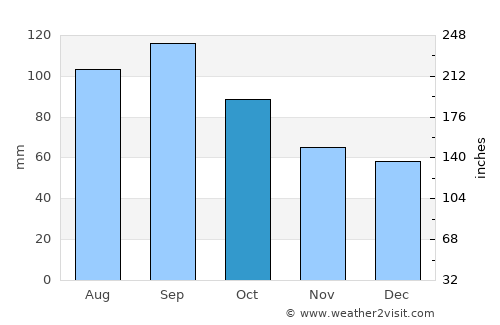
| Avg rainfall | 89 mm 3.5 ins |
| Rainy days | 15 days |
| Sea temperature | 8.8°C 47.8°F |
| Humidity | 79% |
| Windspeed | 13.3kph 8 mph |
On average October is the 5th wettest month of the year in Macamic with around 89mm 3.5 inches of rain making it a a little damp time to visit. This rainfall is typically spread over 15 days, although this may vary considerably.
On the flip side this corresponds to an average of 3 hours of sunshine per day.
October temperatures in Macamic
October rainfall
October hourly sunshine
The data used in these monthly averages covers a period of over 100 years right up until last year. As such they are a valid prediction of what to expect for the weather in Macamic in October 2025.
Other monthly averages
Best places to visit in October
Macamic weather stats
| Hottest month: | July | 22.9°C 73.2°F |
|---|---|---|
| Driest month: | February | 36mm 1.4ins |
| Sunniest month: | July | 8.7hrs |
| Coldest month: | January | -11.8°C 10.8°F |
| Wettest month: | September | 116mm 4.6ins |


Top Canada locations
- Calgary
- Edmonton
- Halifax
- Montréal
- Niagara Falls
- Ottawa
- Québec
- St. John's
- Toronto
- Vancouver
- Whistler
- Winnipeg