Buenos Aires monthly weather averages
What's the weather like in Buenos Aires?
Buenos Aires has a warm temperate climate with four distinct seasons. Summers are hot and humid with frequent thunderstorms while winters are cool and drier with the occasional frost. Spring and fall are transition seasons characterized by changeable weather.
Due to the maritime influences from the adjoining Atlantic Ocean, its climate is temperate with extreme temperatures (both hot and cold) being rare. Thus, cold air coming directly from the south are moderated by the Atlantic Ocean and warmer than winds from the southwest (which are not moderated by it). That said, the highest temperature recorded is 43.3 °C (109.9 °F), and the lowest temperature recorded is −5.4 °C (22.3 °F).
Generally speaking, the warmest month is January, with an average temperature of 25.0 °C (77.0 °F). The coldest month is July, with an average temperature of 11.0 °C (51.8 °F). The average annual rainfall is 1,140 mm (45.3 in). The wettest month is March, with an average rainfall of 130 mm (5.1 in). The driest month is July, with an average rainfall of 30 mm (1.2 in).
The climate of Buenos Aires is also influenced by the Pampero, a cold, dry wind that blows from the south. The Pampero can bring abrupt changes in temperature and weather, such as strong winds and thunderstorms. It is also affexted by the Sudestada, a warm, humid wind that blows from the east. The Sudestada can bring heavy rain and flooding.
The best time to visit Buenos Aires is during the spring (September to November) or fall (March to May). The weather is pleasantly mild during these seasons, and there are fewer tourists.
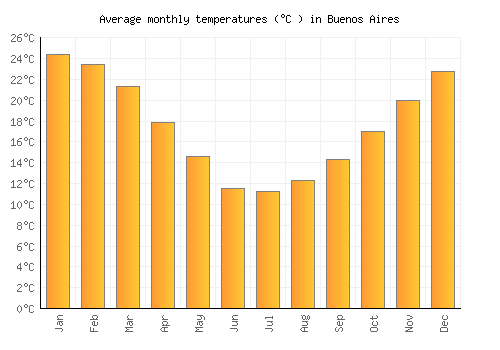
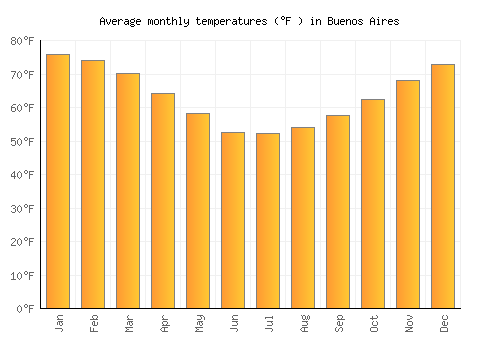
Average daytime temperature
The bar chart below shows the average monthly peak daytime temperatures at Buenos Aires
| Jan | Feb | Mar | Apr | May | Jun | Jul | Aug | Sep | Oct | Nov | Dec | |
|---|---|---|---|---|---|---|---|---|---|---|---|---|
| °C | 29.1 | 27.8 | 25.5 | 22 | 18.6 | 15.2 | 14.8 | 16.3 | 18.4 | 21.2 | 24.5 | 27.4 |
| °F | 84.3 | 82 | 78 | 71.7 | 65.4 | 59.3 | 58.6 | 61.3 | 65.2 | 70.2 | 76.1 | 81.4 |
Please note: these are the average peak daytime temperatures (usually around mid-afternoon) so do not show daytime / night highs and lows. To see the daily range of temperatures have a look at the temperature max / min chart below.
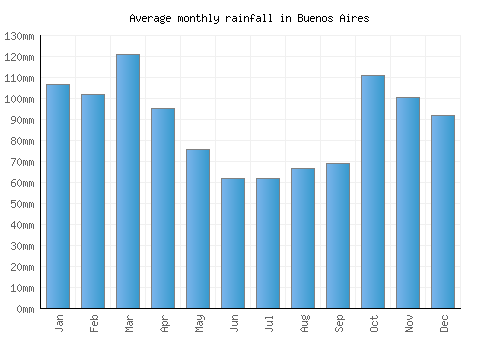
Average rainfall & rainy days
The graph below shows the average rainfall and number of rainy days per month.
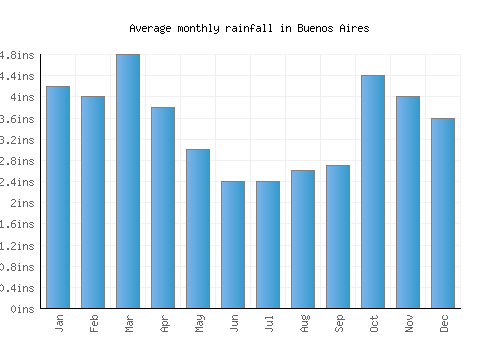
| Jan | Feb | Mar | Apr | May | Jun | Jul | Aug | Sep | Oct | Nov | Dec | |
|---|---|---|---|---|---|---|---|---|---|---|---|---|
| mm | 107 | 102 | 121 | 96 | 76 | 62 | 62 | 67 | 69 | 111 | 101 | 92 |
| inches | 4.2 | 4 | 4.8 | 3.8 | 3 | 2.4 | 2.4 | 2.6 | 2.7 | 4.4 | 4 | 3.6 |
| Rainy days | 8 | 8 | 8 | 7 | 7 | 7 | 7 | 7 | 7 | 10 | 9 | 9 |
Average annual rainfall in Buenos Aires: 971.8mm (382.6 inches)
Average daily sunshine
The bar chart below shows the average daily sunshine hours in Buenos Aires
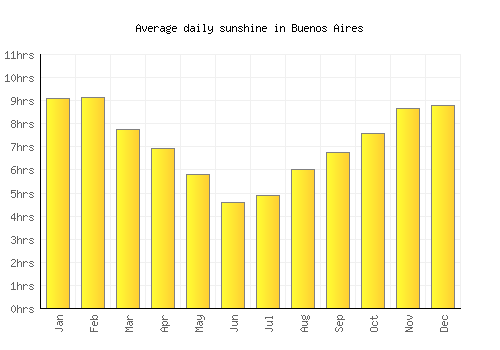
| Jan | Feb | Mar | Apr | May | Jun | Jul | Aug | Sep | Oct | Nov | Dec | |
|---|---|---|---|---|---|---|---|---|---|---|---|---|
| Hrs sunshine | 9.1 | 9.1 | 7.8 | 6.9 | 5.8 | 4.6 | 4.9 | 6 | 6.8 | 7.6 | 8.6 | 8.8 |
Day / night temperatures
The graph below shows the daily range of temperatures for each month.
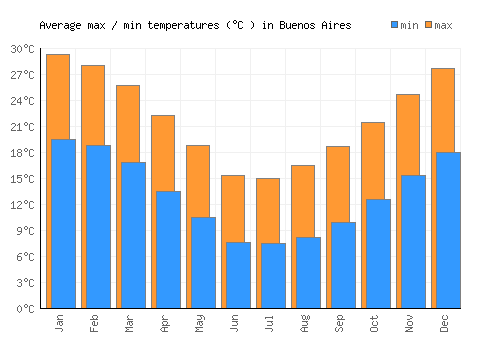
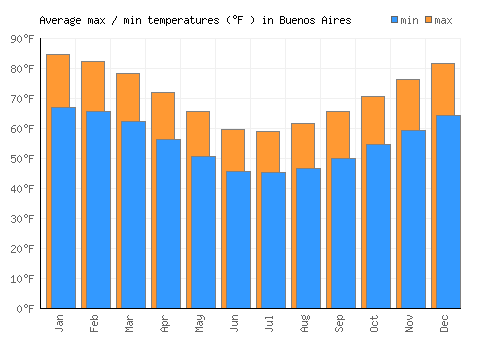
| Jan | Feb | Mar | Apr | May | Jun | Jul | Aug | Sep | Oct | Nov | Dec | |
|---|---|---|---|---|---|---|---|---|---|---|---|---|
| Min °C | 19.5 | 18.8 | 16.9 | 13.6 | 10.5 | 7.7 | 7.5 | 8.2 | 10 | 12.6 | 15.3 | 18 |
| Max °C | 29.3 | 28 | 25.8 | 22.3 | 18.8 | 15.4 | 15 | 16.5 | 18.7 | 21.5 | 24.7 | 27.7 |
| Min °F | 67.1 | 65.8 | 62.3 | 56.4 | 50.8 | 45.8 | 45.4 | 46.7 | 49.9 | 54.6 | 59.5 | 64.3 |
| Max °F | 75.9 | 74.1 | 70.3 | 64.2 | 58.3 | 52.7 | 52.2 | 54.1 | 57.7 | 62.6 | 68 | 73 |
Sea temperature
The graph below shows the average sea temperature.
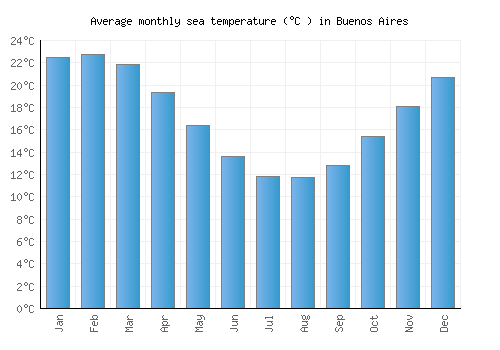
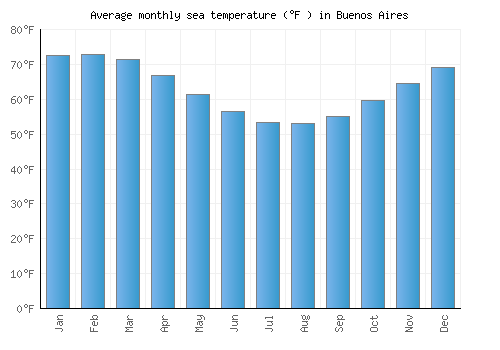
| Jan | Feb | Mar | Apr | May | Jun | Jul | Aug | Sep | Oct | Nov | Dec | |
|---|---|---|---|---|---|---|---|---|---|---|---|---|
| °C | 22.5 | 22.7 | 21.9 | 19.3 | 16.4 | 13.6 | 11.9 | 11.7 | 12.8 | 15.4 | 18.1 | 20.7 |
| °F | 72.5 | 72.9 | 71.4 | 66.8 | 61.4 | 56.5 | 53.4 | 53.1 | 55 | 59.7 | 64.6 | 69.2 |
Wind speed
The graph below shows the average wind speed.
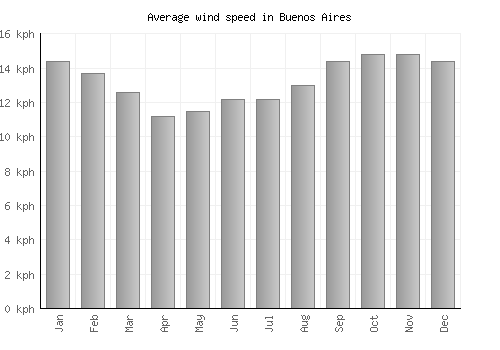
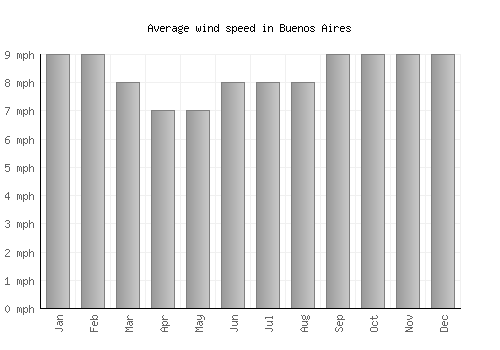
| Jan | Feb | Mar | Apr | May | Jun | Jul | Aug | Sep | Oct | Nov | Dec | |
|---|---|---|---|---|---|---|---|---|---|---|---|---|
| km/h | 14 | 14 | 13 | 11 | 12 | 12 | 12 | 13 | 14 | 15 | 15 | 14 |
| mph | 9 | 9 | 8 | 7 | 7 | 8 | 8 | 8 | 9 | 9 | 9 | 9 |
A monthly average windspeed of over 16km/h or 10mph suggests a location is fairly windy.
Relative humidity
The graph below shows the average relative humidity.
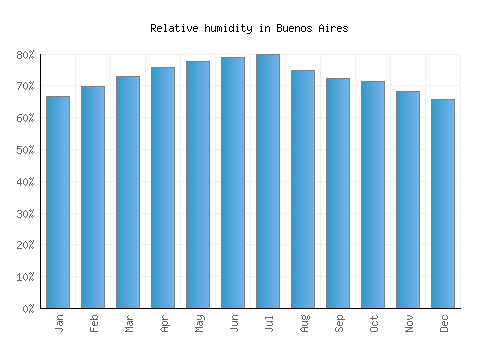
| Jan | Feb | Mar | Apr | May | Jun | Jul | Aug | Sep | Oct | Nov | Dec |
|---|---|---|---|---|---|---|---|---|---|---|---|
| 67% | 70% | 73% | 76% | 78% | 79% | 80% | 75% | 72% | 72% | 68% | 66% |

Other monthly averages
Buenos Aires weather stats
| Hottest month: | January | 29.1°C 84.4°F |
|---|---|---|
| Driest month: | July | 62mm 2.4ins |
| Sunniest month: | February | 9.1hrs |
| Coldest month: | July | 14.8°C 58.6°F |
| Wettest month: | March | 121mm 4.8ins |
| Warmest sea: | February | 22.7°C 72.9°F |