Nuestra Señora del Rosario de Caa Catí monthly weather averages
Average daytime temperature
The bar chart below shows the average monthly peak daytime temperatures at Nuestra Señora del Rosario de Caa Catí
| Jan | Feb | Mar | Apr | May | Jun | Jul | Aug | Sep | Oct | Nov | Dec | |
|---|---|---|---|---|---|---|---|---|---|---|---|---|
| °C | 32.9 | 32.2 | 30.2 | 26.6 | 24 | 21.1 | 21.5 | 22.8 | 24.4 | 27.4 | 29.6 | 32 |
| °F | 91.2 | 89.9 | 86.3 | 79.9 | 75.2 | 69.9 | 70.8 | 73 | 76 | 81.3 | 85.2 | 89.7 |
Please note: these are the average peak daytime temperatures (usually around mid-afternoon) so do not show daytime / night highs and lows. To see the daily range of temperatures have a look at the temperature max / min chart below.
Average rainfall & rainy days
The graph below shows the average rainfall and number of rainy days per month.


| Jan | Feb | Mar | Apr | May | Jun | Jul | Aug | Sep | Oct | Nov | Dec | |
|---|---|---|---|---|---|---|---|---|---|---|---|---|
| mm | 162 | 137 | 161 | 176 | 115 | 89 | 67 | 65 | 98 | 162 | 145 | 136 |
| inches | 6.4 | 5.4 | 6.3 | 6.9 | 4.5 | 3.5 | 2.6 | 2.6 | 3.9 | 6.4 | 5.7 | 5.3 |
| Rainy days | 9 | 8 | 8 | 8 | 6 | 7 | 7 | 7 | 8 | 9 | 9 | 7 |
Average annual rainfall in Nuestra Señora del Rosario de Caa Catí: 1426.067mm (561.4 inches)
Average daily sunshine
The bar chart below shows the average daily sunshine hours in Nuestra Señora del Rosario de Caa Catí

| Jan | Feb | Mar | Apr | May | Jun | Jul | Aug | Sep | Oct | Nov | Dec | |
|---|---|---|---|---|---|---|---|---|---|---|---|---|
| Hrs sunshine | 9.4 | 8.9 | 8 | 7.3 | 6.7 | 5.5 | 6.5 | 7.4 | 7.1 | 8.1 | 9.7 | 9.6 |
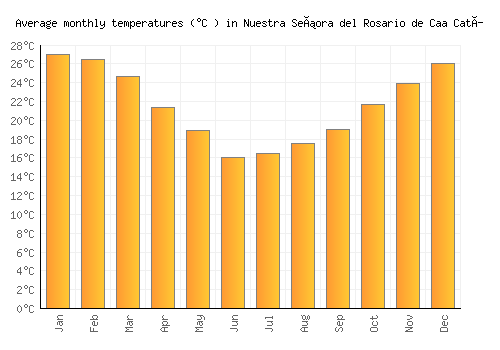
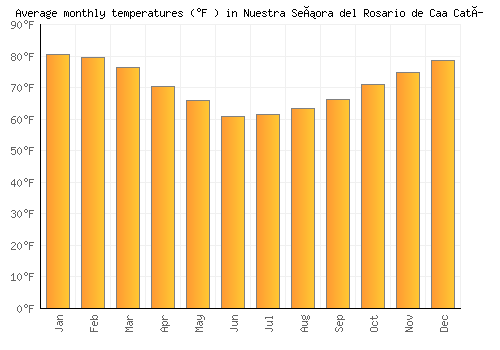
Day / night temperatures
The graph below shows the daily range of temperatures for each month.


| Jan | Feb | Mar | Apr | May | Jun | Jul | Aug | Sep | Oct | Nov | Dec | |
|---|---|---|---|---|---|---|---|---|---|---|---|---|
| Min °C | 20.8 | 20.6 | 19 | 15.9 | 13.6 | 10.9 | 11.2 | 12 | 13.3 | 15.7 | 18 | 19.7 |
| Max °C | 33.2 | 32.5 | 30.5 | 26.9 | 24.3 | 21.3 | 21.8 | 23.1 | 24.7 | 27.7 | 29.9 | 32.4 |
| Min °F | 69.4 | 69 | 66.1 | 60.6 | 56.4 | 51.6 | 52.2 | 53.5 | 55.9 | 60.3 | 64.3 | 67.4 |
| Max °F | 80.6 | 79.7 | 76.5 | 70.5 | 66 | 61 | 61.7 | 63.5 | 66.2 | 71.1 | 75 | 78.8 |
Sea temperature
The graph below shows the average sea temperature.


| Jan | Feb | Mar | Apr | May | Jun | Jul | Aug | Sep | Oct | Nov | Dec | |
|---|---|---|---|---|---|---|---|---|---|---|---|---|
| °C | 23.5 | 23.9 | 23.4 | 22 | 20.2 | 18.5 | 17.3 | 17 | 17.5 | 18.7 | 20.2 | 21.9 |
| °F | 74.3 | 75.1 | 74.1 | 71.6 | 68.3 | 65.4 | 63.2 | 62.7 | 63.6 | 65.7 | 68.3 | 71.4 |
Wind speed
The graph below shows the average wind speed.


| Jan | Feb | Mar | Apr | May | Jun | Jul | Aug | Sep | Oct | Nov | Dec | |
|---|---|---|---|---|---|---|---|---|---|---|---|---|
| km/h | 12 | 12 | 11 | 11 | 11 | 12 | 13 | 13 | 14 | 13 | 13 | 12 |
| mph | 7 | 7 | 7 | 7 | 7 | 8 | 8 | 8 | 9 | 8 | 8 | 8 |
A monthly average windspeed of over 16km/h or 10mph suggests a location is fairly windy.
Relative humidity
The graph below shows the average relative humidity.

| Jan | Feb | Mar | Apr | May | Jun | Jul | Aug | Sep | Oct | Nov | Dec |
|---|---|---|---|---|---|---|---|---|---|---|---|
| 69% | 72% | 75% | 77% | 79% | 80% | 77% | 74% | 72% | 71% | 69% | 66% |
Other monthly averages
Nuestra Señora del Rosario de Caa Catí weather stats
| Hottest month: | January | 32.9°C 91.2°F |
|---|---|---|
| Driest month: | August | 65mm 2.6ins |
| Sunniest month: | November | 9.7hrs |
| Coldest month: | June | 21.1°C 70°F |
| Wettest month: | April | 176mm 6.9ins |
| Warmest sea: | February | 23.9°C 75°F |