Rio de Janeiro monthly weather averages
What's the weather like in Rio de Janeiro?
Rio de Janeiro has a tropical climate, with hot, humid summers and warm, sunny winters. Being in the southern hemisphere June to August is the winter season, when temperatures are a little cooler and rainfall is higher. The coldest month of the year is July, with an average low of 17 °C (63 °F) and high of 22 °C (72 °F).
November to March is the summer season, when temperatures are at their highest and humidity is at its peak. The average summer high temperature is around 27 °C (81 °F) with a low of 21 °C (70 °F).
Rainfall is abundant in Rio, with an annual average of 1,500 mm (60 in). It is highest in the months of December and January, when temperatures are the highest. June to August is the dry season, when rainfall is low and temperatures are also the lowest.
The best time to visit Rio de Janeiro is during the spring (September to November) or fall (March to May). The weather is warm and sunny during these months, and there is less rainfall.
Average daytime temperature
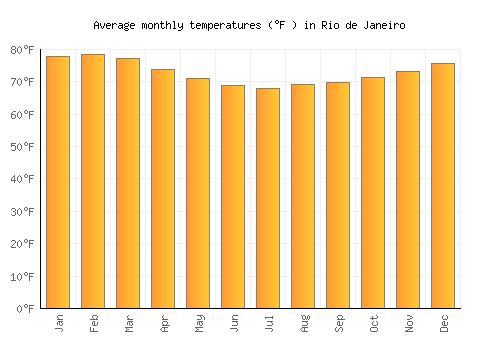
The bar chart below shows the average monthly peak daytime temperatures at Rio de Janeiro
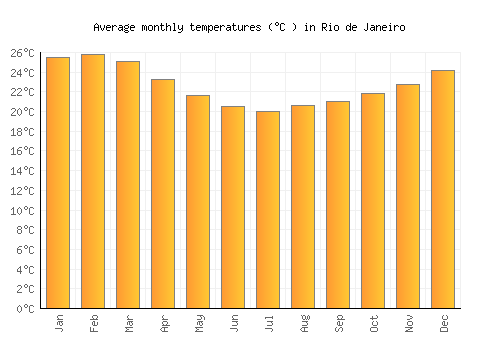
| Jan | Feb | Mar | Apr | May | Jun | Jul | Aug | Sep | Oct | Nov | Dec | |
|---|---|---|---|---|---|---|---|---|---|---|---|---|
| °C | 29.5 | 29.9 | 29 | 27 | 25.5 | 24.6 | 24.2 | 24.9 | 24.9 | 25.5 | 26.5 | 28 |
| °F | 85.1 | 85.8 | 84.2 | 80.6 | 77.8 | 76.3 | 75.5 | 76.8 | 76.7 | 77.8 | 79.6 | 82.3 |
Please note: these are the average peak daytime temperatures (usually around mid-afternoon) so do not show daytime / night highs and lows. To see the daily range of temperatures have a look at the temperature max / min chart below.
Average rainfall & rainy days
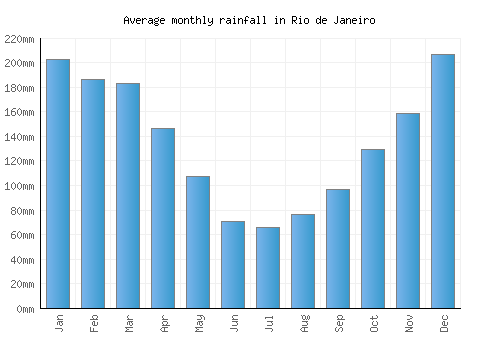
The graph below shows the average rainfall and number of rainy days per month.

| Jan | Feb | Mar | Apr | May | Jun | Jul | Aug | Sep | Oct | Nov | Dec | |
|---|---|---|---|---|---|---|---|---|---|---|---|---|
| mm | 203 | 186 | 183 | 146 | 107 | 71 | 66 | 76 | 96 | 129 | 159 | 207 |
| inches | 8 | 7.3 | 7.2 | 5.8 | 4.2 | 2.8 | 2.6 | 3 | 3.8 | 5.1 | 6.2 | 8.1 |
| Rainy days | 20 | 16 | 15 | 15 | 12 | 10 | 9 | 9 | 12 | 18 | 19 | 21 |
Average annual rainfall in Rio de Janeiro: 1563.033mm (615.4 inches)
Average daily sunshine
The bar chart below shows the average daily sunshine hours in Rio de Janeiro

| Jan | Feb | Mar | Apr | May | Jun | Jul | Aug | Sep | Oct | Nov | Dec | |
|---|---|---|---|---|---|---|---|---|---|---|---|---|
| Hrs sunshine | 6.8 | 7.1 | 6.7 | 6.2 | 6.2 | 6.3 | 6.6 | 6.6 | 5.1 | 5.1 | 5.7 | 5.5 |
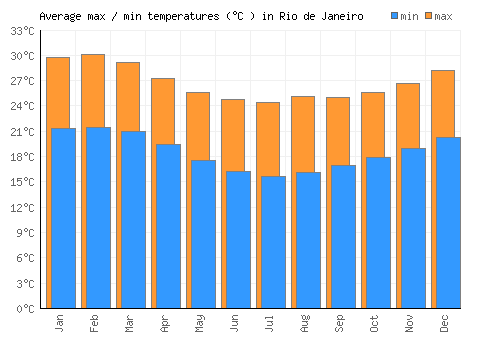
Day / night temperatures
The graph below shows the daily range of temperatures for each month.

| Jan | Feb | Mar | Apr | May | Jun | Jul | Aug | Sep | Oct | Nov | Dec | |
|---|---|---|---|---|---|---|---|---|---|---|---|---|
| Min °C | 21.3 | 21.5 | 21 | 19.4 | 17.6 | 16.2 | 15.6 | 16.1 | 17 | 18 | 19 | 20.3 |
| Max °C | 29.7 | 30.1 | 29.2 | 27.2 | 25.7 | 24.8 | 24.4 | 25.1 | 25.1 | 25.7 | 26.7 | 28.2 |
| Min °F | 70.3 | 70.7 | 69.8 | 66.9 | 63.6 | 61.2 | 60.1 | 61 | 62.5 | 64.3 | 66.1 | 68.5 |
| Max °F | 77.9 | 78.4 | 77.2 | 73.9 | 70.9 | 68.9 | 68 | 69.1 | 69.8 | 71.2 | 73 | 75.6 |
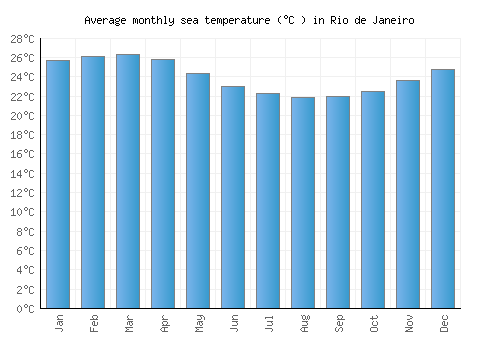
Sea temperature
The graph below shows the average sea temperature.

| Jan | Feb | Mar | Apr | May | Jun | Jul | Aug | Sep | Oct | Nov | Dec | |
|---|---|---|---|---|---|---|---|---|---|---|---|---|
| °C | 25.7 | 26.1 | 26.3 | 25.8 | 24.3 | 23 | 22.3 | 21.9 | 21.9 | 22.5 | 23.6 | 24.8 |
| °F | 78.2 | 79 | 79.3 | 78.5 | 75.8 | 73.5 | 72.1 | 71.4 | 71.5 | 72.5 | 74.4 | 76.6 |
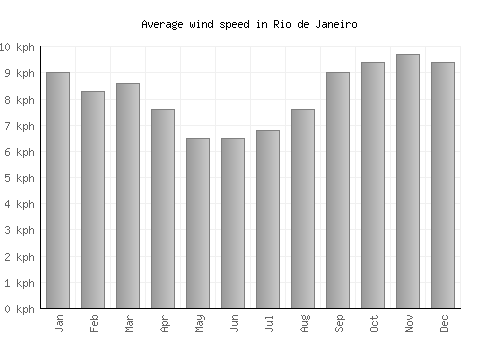
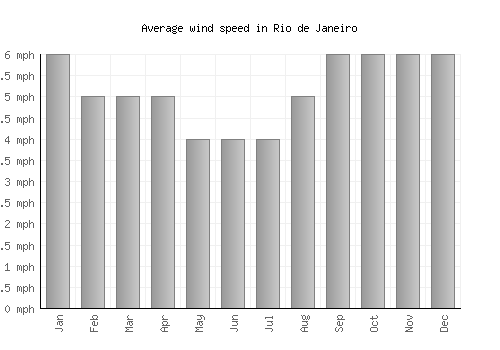
Wind speed
The graph below shows the average wind speed.
| Jan | Feb | Mar | Apr | May | Jun | Jul | Aug | Sep | Oct | Nov | Dec | |
|---|---|---|---|---|---|---|---|---|---|---|---|---|
| km/h | 9 | 8 | 9 | 8 | 7 | 7 | 7 | 8 | 9 | 9 | 10 | 9 |
| mph | 6 | 5 | 5 | 5 | 4 | 4 | 4 | 5 | 6 | 6 | 6 | 6 |
A monthly average windspeed of over 16km/h or 10mph suggests a location is fairly windy.
Relative humidity
The graph below shows the average relative humidity.
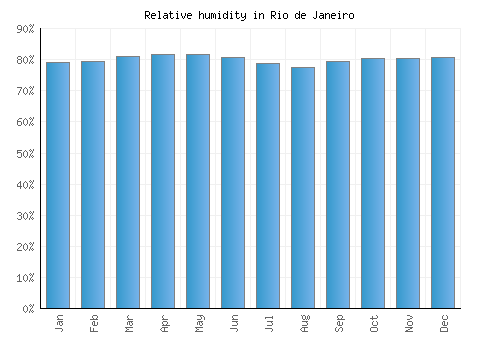
| Jan | Feb | Mar | Apr | May | Jun | Jul | Aug | Sep | Oct | Nov | Dec |
|---|---|---|---|---|---|---|---|---|---|---|---|
| 79% | 80% | 81% | 82% | 82% | 81% | 79% | 78% | 79% | 80% | 80% | 81% |

Other monthly averages
Rio de Janeiro weather stats
| Hottest month: | February | 29.9°C 85.8°F |
|---|---|---|
| Driest month: | July | 66mm 2.6ins |
| Sunniest month: | July | 6.6hrs |
| Coldest month: | July | 24.2°C 75.6°F |
| Wettest month: | December | 207mm 8.1ins |
| Warmest sea: | March | 26.3°C 79.3°F |