Beijing monthly weather averages
What's the weather like in Beijing?
Beijing is located in Northern China and has a continental monsoon climate. This means that the city experiences hot, humid summers and cold, dry winters. Summer temperatures in Beijing can reach into the high 30s Celsius (90s Fahrenheit), with humidity levels of up to 90%. Winters are cold, with temperatures as low as -10 Celsius (14 Fahrenheit). The city has a distinct seasonal cycle, with spring and autumn being the most pleasant times of the year.
Rainfall in Beijing is fairly evenly distributed throughout the year, with the heaviest precipitation in July and August. The city is also prone to sandstorms, which occur primarily during the spring months. Snowfall is common during the winter months, with occasional snowfalls in the spring and autumn as well.
Overall, the climate in Beijing is highly variable, and temperatures can change dramatically from day to day. The best time to visit Beijing is during the spring and autumn months, when temperatures are milder and the weather is more pleasant.
Average daytime temperature
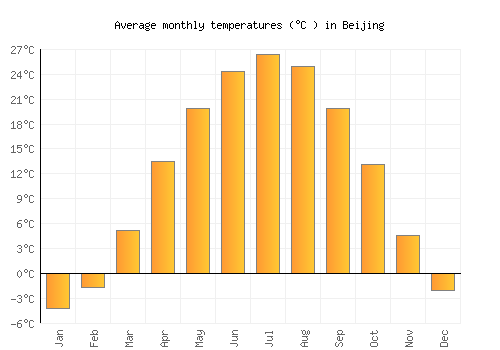
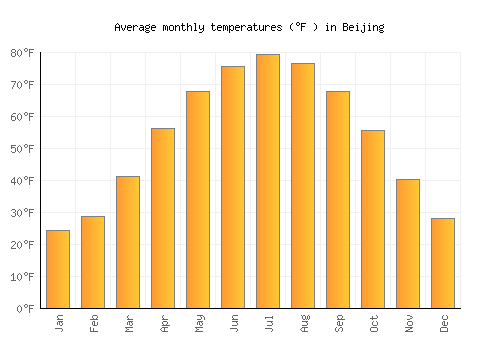
The bar chart below shows the average monthly peak daytime temperatures at Beijing
| Jan | Feb | Mar | Apr | May | Jun | Jul | Aug | Sep | Oct | Nov | Dec | |
|---|---|---|---|---|---|---|---|---|---|---|---|---|
| °C | 1.2 | 3.8 | 11.1 | 19.7 | 26.4 | 30.3 | 31 | 29.5 | 25.6 | 18.9 | 9.7 | 2.9 |
| °F | 34.2 | 38.8 | 52 | 67.5 | 79.5 | 86.5 | 87.8 | 85 | 78.1 | 66 | 49.5 | 37.2 |
Please note: these are the average peak daytime temperatures (usually around mid-afternoon) so do not show daytime / night highs and lows. To see the daily range of temperatures have a look at the temperature max / min chart below.
Average rainfall & rainy days
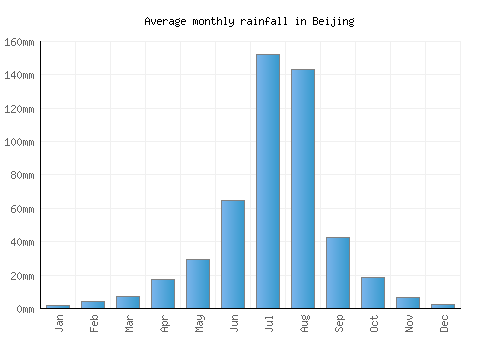
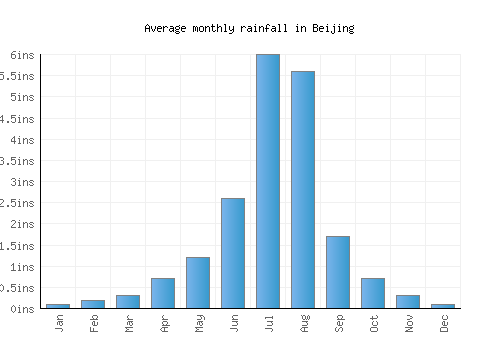
The graph below shows the average rainfall and number of rainy days per month.
| Jan | Feb | Mar | Apr | May | Jun | Jul | Aug | Sep | Oct | Nov | Dec | |
|---|---|---|---|---|---|---|---|---|---|---|---|---|
| mm | 2 | 4 | 7 | 18 | 29 | 65 | 152 | 143 | 42 | 18 | 7 | 2 |
| inches | 0.1 | 0.2 | 0.3 | 0.7 | 1.2 | 2.6 | 6 | 5.6 | 1.7 | 0.7 | 0.3 | 0.1 |
| Rainy days | 2 | 3 | 4 | 5 | 6 | 9 | 14 | 12 | 7 | 6 | 4 | 2 |
Average annual rainfall in Beijing: 646.234mm (254.4 inches)
Average daily sunshine
The bar chart below shows the average daily sunshine hours in Beijing
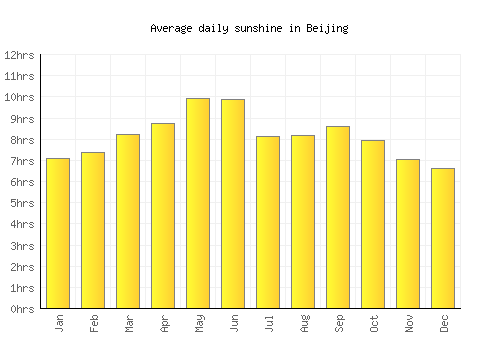
| Jan | Feb | Mar | Apr | May | Jun | Jul | Aug | Sep | Oct | Nov | Dec | |
|---|---|---|---|---|---|---|---|---|---|---|---|---|
| Hrs sunshine | 7.1 | 7.4 | 8.2 | 8.7 | 9.9 | 9.9 | 8.1 | 8.2 | 8.6 | 7.9 | 7 | 6.6 |
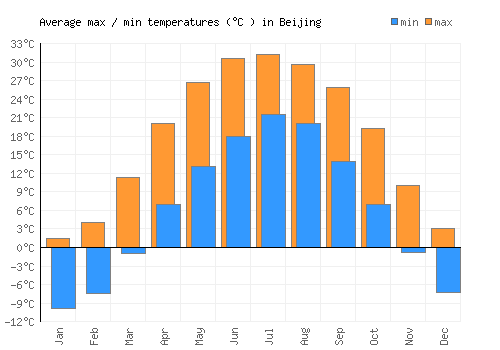
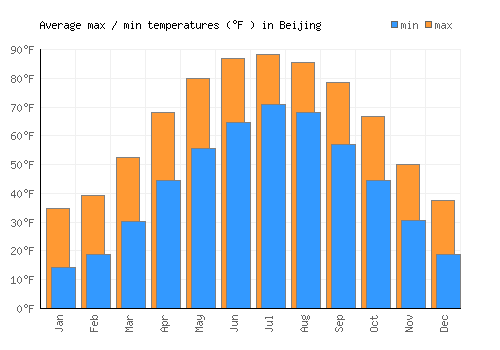
Day / night temperatures
The graph below shows the daily range of temperatures for each month.
| Jan | Feb | Mar | Apr | May | Jun | Jul | Aug | Sep | Oct | Nov | Dec | |
|---|---|---|---|---|---|---|---|---|---|---|---|---|
| Min °C | -9.9 | -7.5 | -1 | 7 | 13.1 | 18.1 | 21.6 | 20.1 | 13.9 | 7 | -0.8 | -7.4 |
| Max °C | 1.5 | 4.1 | 11.4 | 20.1 | 26.7 | 30.6 | 31.3 | 29.7 | 25.9 | 19.2 | 10 | 3.2 |
| Min °F | 14.2 | 18.6 | 30.2 | 44.5 | 55.6 | 64.5 | 70.8 | 68.2 | 57 | 44.6 | 30.6 | 18.8 |
| Max °F | 24.4 | 28.9 | 41.4 | 56.3 | 67.8 | 75.7 | 79.5 | 76.8 | 67.8 | 55.6 | 40.3 | 28.2 |
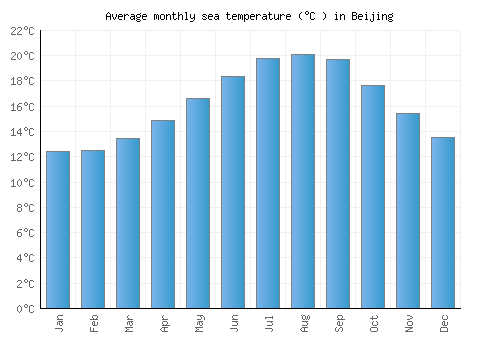
Sea temperature
The graph below shows the average sea temperature.
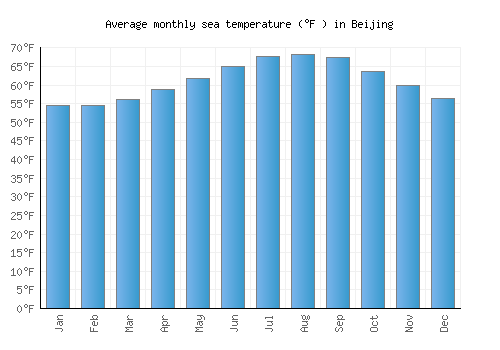
| Jan | Feb | Mar | Apr | May | Jun | Jul | Aug | Sep | Oct | Nov | Dec | |
|---|---|---|---|---|---|---|---|---|---|---|---|---|
| °C | 12.4 | 12.5 | 13.4 | 14.9 | 16.6 | 18.4 | 19.8 | 20.1 | 19.7 | 17.6 | 15.4 | 13.5 |
| °F | 54.4 | 54.5 | 56.2 | 58.8 | 61.8 | 65.1 | 67.6 | 68.2 | 67.4 | 63.7 | 59.8 | 56.3 |
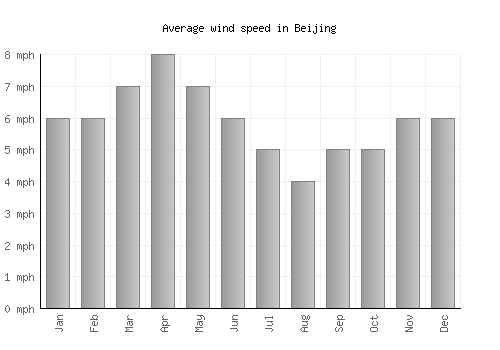
Wind speed
The graph below shows the average wind speed.
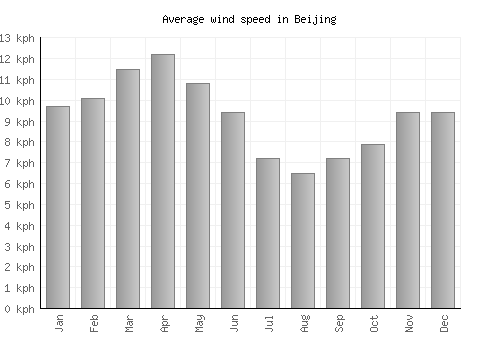
| Jan | Feb | Mar | Apr | May | Jun | Jul | Aug | Sep | Oct | Nov | Dec | |
|---|---|---|---|---|---|---|---|---|---|---|---|---|
| km/h | 10 | 10 | 12 | 12 | 11 | 9 | 7 | 7 | 7 | 8 | 9 | 9 |
| mph | 6 | 6 | 7 | 8 | 7 | 6 | 5 | 4 | 5 | 5 | 6 | 6 |
A monthly average windspeed of over 16km/h or 10mph suggests a location is fairly windy.
Relative humidity
The graph below shows the average relative humidity.
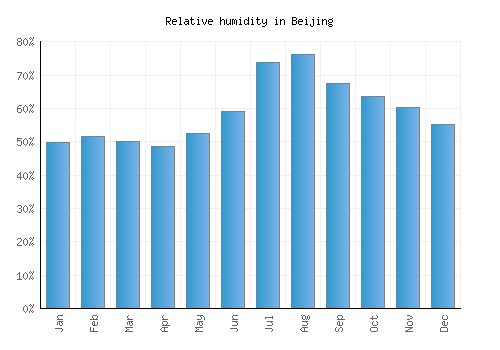
| Jan | Feb | Mar | Apr | May | Jun | Jul | Aug | Sep | Oct | Nov | Dec |
|---|---|---|---|---|---|---|---|---|---|---|---|
| 50% | 52% | 50% | 49% | 53% | 59% | 74% | 76% | 67% | 64% | 60% | 55% |

Other monthly averages
Beijing weather stats
| Hottest month: | July | 31°C 87.8°F |
|---|---|---|
| Driest month: | January | 2mm 0.1ins |
| Sunniest month: | January | 7.1hrs |
| Coldest month: | January | 1.2°C 34.2°F |
| Wettest month: | July | 152mm 6ins |
| Warmest sea: | August | 20.1°C 68.2°F |

Locations nearby
Top China locations
- Beijing
- Chengdu
- Chongqing
- Guangzhou
- Guilin
- Guiyang
- Hangzhou
- Kunming
- Lhasa
- Pingyao
- Qingdao
- Shanghai
- Shenzhen
- Tianjin
- Xiamen
- Xi’an
- Zhangjiajie