Shanghai monthly weather averages
What's the weather like in Shanghai?
Shanghai has a humid subtropical climate with hot and humid summers and cool, dry winters. The city experiences four distinct seasons, including a chilly autumn/fall and a warm spring. Temperatures in Shanghai can range from -2.7° (27.1°) in January to 34.7° (94.5°) in July. However, average temperatures of 4 °C (39 °F) are more common for the coldest month and 29 °C (84 °F) for the warmest.
Rainfall in Shanghai is abundant throughout the year, with the majority of precipitation falling between April and June. Shanghai receives an average of 1,200 mm (47 inches) of precipitation per year. The city also experiences occasional typhoons during the summer and autumn months.
Shanghai's air quality has been steadily improving since the 1990s, when industrial pollution was particularly bad. However, air pollution is still a problem, especially during the winter months, when coal burning for heating is common.
Overall, Shanghai has a generally pleasant climate, with warm and humid summers and cool and dry winters.
Average daytime temperature
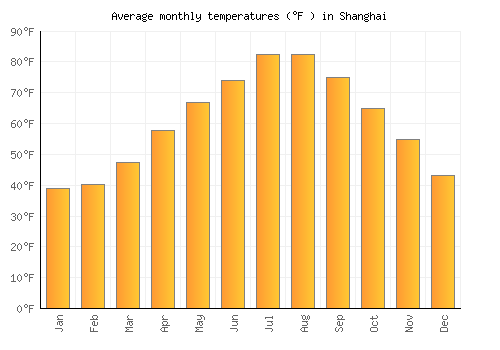
The bar chart below shows the average monthly peak daytime temperatures at Shanghai
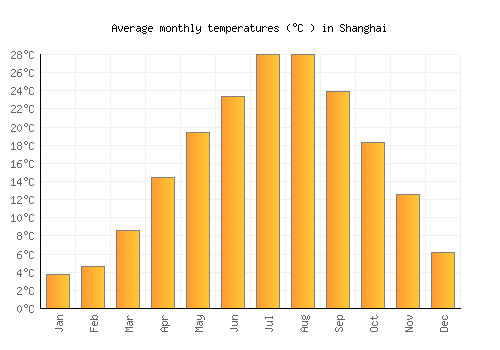
| Jan | Feb | Mar | Apr | May | Jun | Jul | Aug | Sep | Oct | Nov | Dec | |
|---|---|---|---|---|---|---|---|---|---|---|---|---|
| °C | 7.2 | 7.9 | 12.2 | 18.2 | 23.1 | 26.7 | 31.2 | 31.2 | 27 | 21.9 | 16.4 | 10.1 |
| °F | 45 | 46.3 | 53.9 | 64.8 | 73.6 | 80 | 88.2 | 88.2 | 80.7 | 71.4 | 61.5 | 50.1 |
Please note: these are the average peak daytime temperatures (usually around mid-afternoon) so do not show daytime / night highs and lows. To see the daily range of temperatures have a look at the temperature max / min chart below.
Average rainfall & rainy days
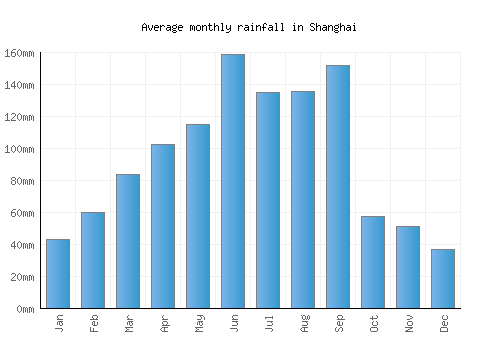
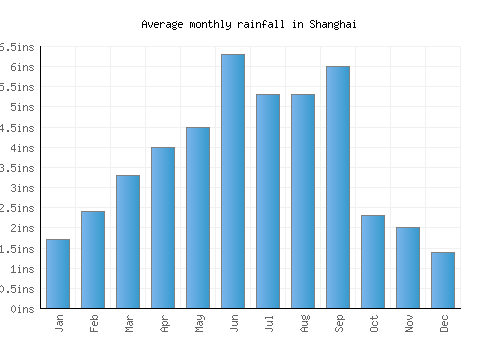
The graph below shows the average rainfall and number of rainy days per month.
| Jan | Feb | Mar | Apr | May | Jun | Jul | Aug | Sep | Oct | Nov | Dec | |
|---|---|---|---|---|---|---|---|---|---|---|---|---|
| mm | 43 | 60 | 84 | 103 | 115 | 159 | 135 | 136 | 152 | 58 | 52 | 37 |
| inches | 1.7 | 2.4 | 3.3 | 4 | 4.5 | 6.3 | 5.3 | 5.3 | 6 | 2.3 | 2 | 1.4 |
| Rainy days | 11 | 12 | 14 | 15 | 15 | 15 | 12 | 11 | 13 | 12 | 11 | 10 |
Average annual rainfall in Shanghai: 1286.767mm (506.6 inches)
Average daily sunshine
The bar chart below shows the average daily sunshine hours in Shanghai
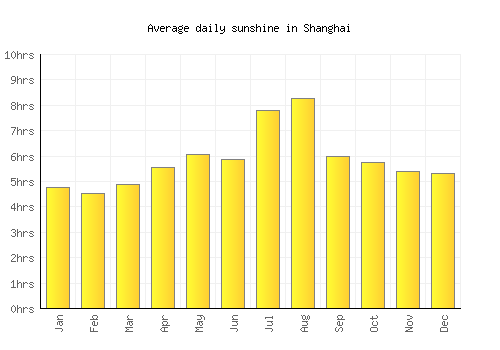
| Jan | Feb | Mar | Apr | May | Jun | Jul | Aug | Sep | Oct | Nov | Dec | |
|---|---|---|---|---|---|---|---|---|---|---|---|---|
| Hrs sunshine | 4.8 | 4.5 | 4.9 | 5.6 | 6.1 | 5.9 | 7.8 | 8.3 | 6 | 5.8 | 5.4 | 5.3 |
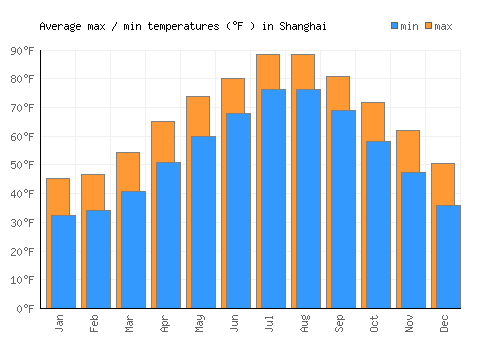
Day / night temperatures
The graph below shows the daily range of temperatures for each month.
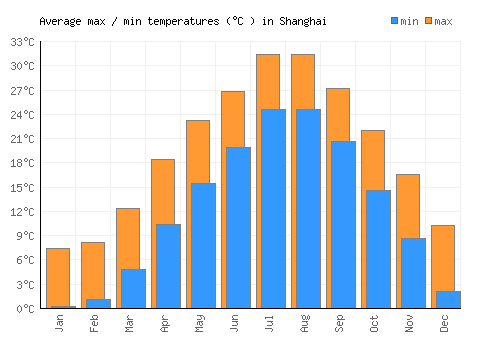
| Jan | Feb | Mar | Apr | May | Jun | Jul | Aug | Sep | Oct | Nov | Dec | |
|---|---|---|---|---|---|---|---|---|---|---|---|---|
| Min °C | 0.2 | 1.1 | 4.9 | 10.4 | 15.5 | 20 | 24.6 | 24.6 | 20.6 | 14.6 | 8.6 | 2.2 |
| Max °C | 7.4 | 8.1 | 12.4 | 18.4 | 23.3 | 26.9 | 31.4 | 31.4 | 27.2 | 22.1 | 16.6 | 10.3 |
| Min °F | 32.4 | 34 | 40.7 | 50.7 | 59.9 | 67.9 | 76.3 | 76.3 | 69.1 | 58.2 | 47.5 | 35.9 |
| Max °F | 38.8 | 40.3 | 47.5 | 57.9 | 66.9 | 74.1 | 82.4 | 82.4 | 75 | 64.9 | 54.7 | 43.2 |
Sea temperature
The graph below shows the average sea temperature.
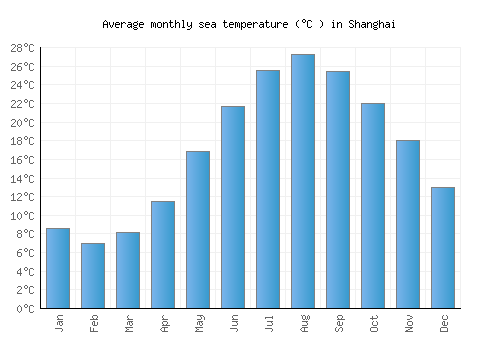
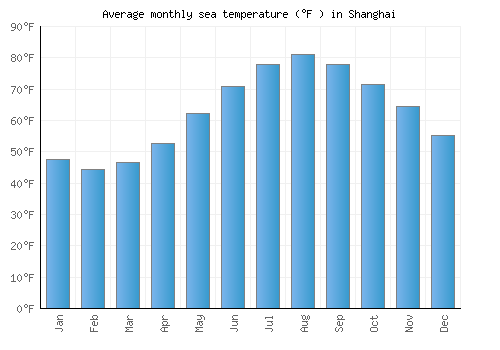
| Jan | Feb | Mar | Apr | May | Jun | Jul | Aug | Sep | Oct | Nov | Dec | |
|---|---|---|---|---|---|---|---|---|---|---|---|---|
| °C | 8.6 | 7 | 8.2 | 11.5 | 16.9 | 21.7 | 25.5 | 27.3 | 25.4 | 22 | 18 | 12.9 |
| °F | 47.5 | 44.5 | 46.7 | 52.6 | 62.4 | 71 | 78 | 81.1 | 77.8 | 71.6 | 64.5 | 55.3 |
Wind speed
The graph below shows the average wind speed.
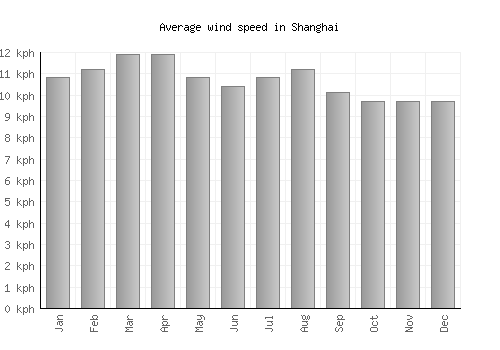
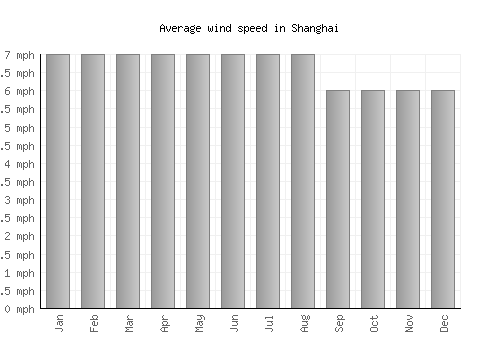
| Jan | Feb | Mar | Apr | May | Jun | Jul | Aug | Sep | Oct | Nov | Dec | |
|---|---|---|---|---|---|---|---|---|---|---|---|---|
| km/h | 11 | 11 | 12 | 12 | 11 | 10 | 11 | 11 | 10 | 10 | 10 | 10 |
| mph | 7 | 7 | 7 | 7 | 7 | 7 | 7 | 7 | 6 | 6 | 6 | 6 |
A monthly average windspeed of over 16km/h or 10mph suggests a location is fairly windy.
Relative humidity
The graph below shows the average relative humidity.
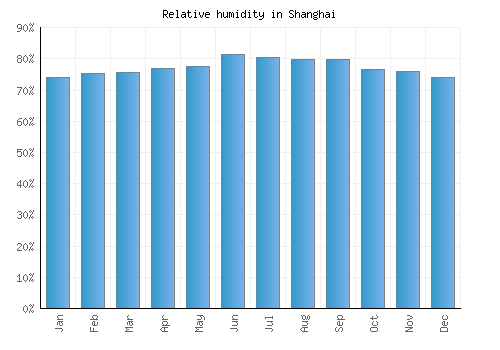
| Jan | Feb | Mar | Apr | May | Jun | Jul | Aug | Sep | Oct | Nov | Dec |
|---|---|---|---|---|---|---|---|---|---|---|---|
| 74% | 75% | 76% | 77% | 78% | 81% | 81% | 80% | 80% | 77% | 76% | 74% |

Other monthly averages
Shanghai weather stats
| Hottest month: | July | 31.2°C 88.2°F |
|---|---|---|
| Driest month: | December | 37mm 1.5ins |
| Sunniest month: | August | 8.3hrs |
| Coldest month: | January | 7.2°C 45°F |
| Wettest month: | June | 159mm 6.3ins |
| Warmest sea: | August | 27.3°C 81.1°F |

Locations nearby
Top China locations
- Beijing
- Chengdu
- Chongqing
- Guangzhou
- Guilin
- Guiyang
- Hangzhou
- Kunming
- Lhasa
- Pingyao
- Qingdao
- Shanghai
- Shenzhen
- Tianjin
- Xiamen
- Xi’an
- Zhangjiajie