Thung Khao Luang Weather in September
What's the weather like in Thung Khao Luang (Roi Et) in September 2025?
The climate in Thung Khao Luang during September can be summarized as hot, humid and very wet.
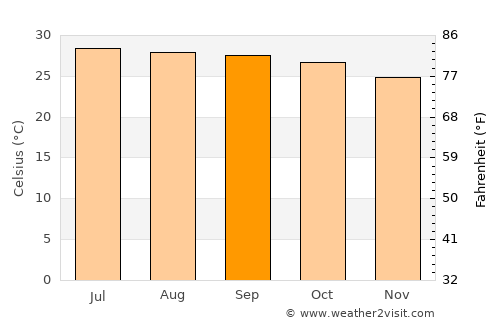
September is in the fall / autumn in Thung Khao Luang and is typically the 6th coldest month of the year. Daytime maximum temperatures average around a steamy 31°C (88°F), whilst at night 24°C (75°F) is normal.
| Daytime temperature | 31.1°C 88°F |
|---|---|
| Nightly temperature | 24.1°C 75.4°F |
| Average temperature | 27.6°C 81.7°F |
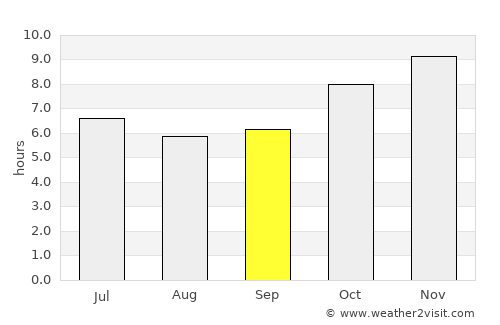
| Daily sunshine | 6.2 hrs |
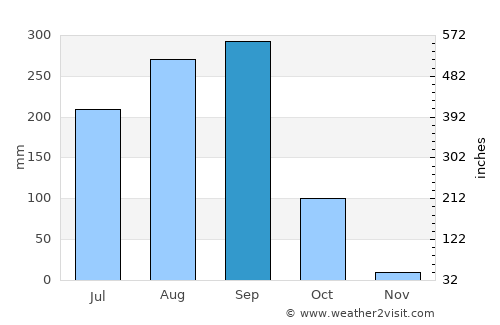
| Avg rainfall | 292 mm 11.5 ins |
| Rainy days | 18 days |
| Sea temperature | 29°C 84.1°F |
| Humidity | 82% |
| Windspeed | 3.6kph 2 mph |
On average September is the wettest month of the year in Thung Khao Luang with around 292mm 11.5 inches of rain making it a very wet time to visit. This rainfall is typically spread over 18 days, although this may vary considerably.
On the flip side this corresponds to an average of 6.2 hours of sunshine per day.
September temperatures in Thung Khao Luang
September rainfall
September hourly sunshine
The data used in these monthly averages covers a period of over 100 years right up until last year. As such they are a valid prediction of what to expect for the weather in Thung Khao Luang in September 2025.
Other monthly averages
Best places to visit in September
Thung Khao Luang weather stats
| Hottest month: | April | 35.4°C 95.7°F |
|---|---|---|
| Driest month: | December | 1mm 0ins |
| Sunniest month: | January | 9.9hrs |
| Coldest month: | December | 28.9°C 84°F |
| Wettest month: | September | 292mm 11.5ins |