Xilitla Weather in November
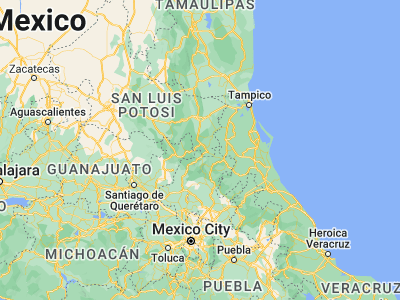
What's the weather like in Xilitla (San Luis Potosí) in November 2025?
The climate in Xilitla during November can be summarized as warm, humid and a little damp.
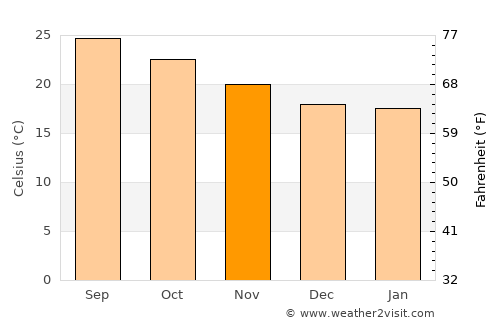
November is in the fall / autumn in Xilitla and is typically the 4th coldest month of the year. Daytime maximum temperatures average around 26°C (80°F), whilst at night 14°C (57°F) is normal.
| Daytime temperature | 26.4°C 79.5°F |
|---|---|
| Nightly temperature | 13.6°C 56.5°F |
| Average temperature | 20°C 68°F |
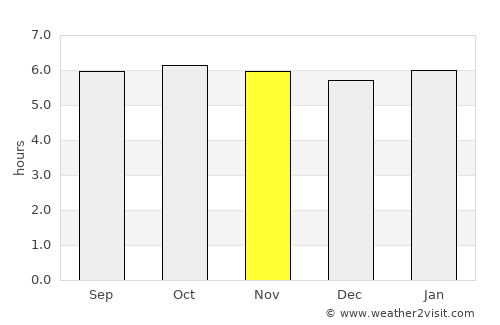
| Daily sunshine | 6 hrs |
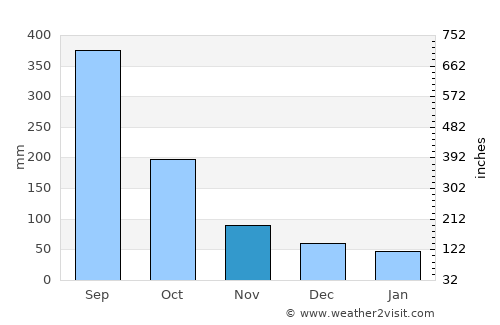
| Avg rainfall | 90 mm 3.5 ins |
| Rainy days | 7 days |
| Sea temperature | 26.3°C 79.3°F |
| Humidity | 75% |
| Windspeed | 9kph 6 mph |
On average November is the 6th driest month of the year in Xilitla with around 90mm 3.5 inches of rain making it a a little damp time to visit. This rainfall is typically spread over 7 days, although this may vary considerably.
On the flip side this corresponds to an average of 6 hours of sunshine per day.
November temperatures in Xilitla
November rainfall
November hourly sunshine
The data used in these monthly averages covers a period of over 100 years right up until last year. As such they are a valid prediction of what to expect for the weather in Xilitla in November 2025.
Other monthly averages
Best places to visit in November
Xilitla weather stats
| Hottest month: | May | 34°C 93.2°F |
|---|---|---|
| Driest month: | January | 47mm 1.9ins |
| Sunniest month: | February | 6.6hrs |
| Coldest month: | January | 24.3°C 75.7°F |
| Wettest month: | September | 375mm 14.8ins |

Top Mexico locations
- Acapulco
- Cabo San Lucas
- Cancún
- Cozumel
- Guadalajara
- Guanajuato
- Mazatlán
- Mexico City
- Oaxaca de Juárez
- Playa del Carmen
- Puebla
- Puerto Vallarta
- San Miguel de Allende
- Todos Santos
- Zihuatanejo