Barcelona monthly weather averages
What's the weather like in Barcelona?
The climate of Barcelona is unsuprisingly classified as a Mediterranean climate, which is characterized by hot and dry summers, and mild and wet winters. Summers in Barcelona typically last from June through to September, and temperatures during this time can range from an average high of 28 °C (82 °F) in June to an average high of 30 °C (86 °F) in August.
Winters are mild, with the temperature ranging from an average low of 5 °C (41 °F) in December to an average low of 8 °C (46 °F) in February. Rainfall is fairly evenly distributed throughout the year, with an average of 10 days of rain per month, although it is typically wettest in October. The humidity in Barcelona can be quite high during the summer months, but drops during the winter.
Average daytime temperature
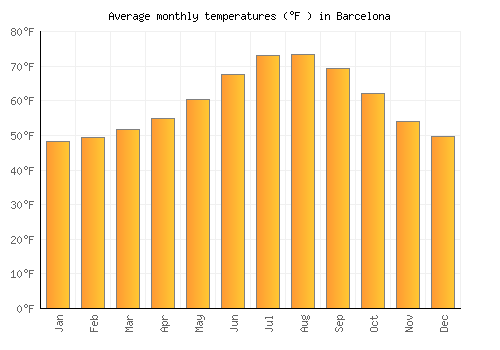
The bar chart below shows the average monthly peak daytime temperatures at Barcelona
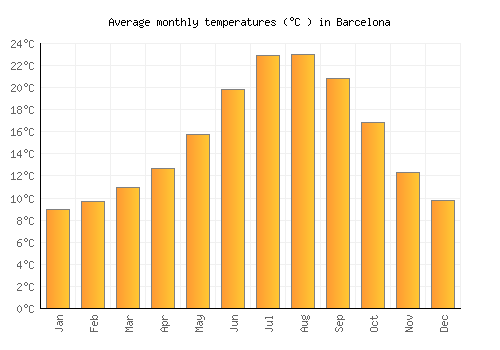
| Jan | Feb | Mar | Apr | May | Jun | Jul | Aug | Sep | Oct | Nov | Dec | |
|---|---|---|---|---|---|---|---|---|---|---|---|---|
| °C | 12.8 | 13.6 | 15 | 16.6 | 19.6 | 23.6 | 26.9 | 26.8 | 24.6 | 20.7 | 16.1 | 13.5 |
| °F | 55 | 56.4 | 58.9 | 61.8 | 67.2 | 74.4 | 80.3 | 80.3 | 76.2 | 69.2 | 60.9 | 56.2 |
Please note: these are the average peak daytime temperatures (usually around mid-afternoon) so do not show daytime / night highs and lows. To see the daily range of temperatures have a look at the temperature max / min chart below.
Average rainfall & rainy days
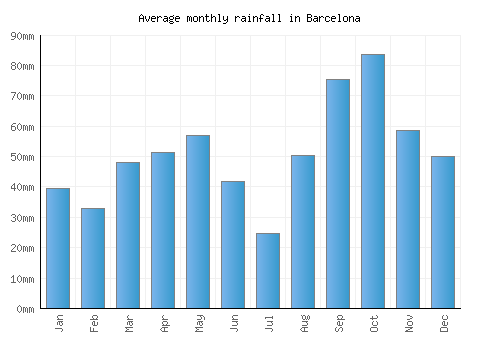
The graph below shows the average rainfall and number of rainy days per month.

| Jan | Feb | Mar | Apr | May | Jun | Jul | Aug | Sep | Oct | Nov | Dec | |
|---|---|---|---|---|---|---|---|---|---|---|---|---|
| mm | 39 | 33 | 48 | 51 | 57 | 42 | 25 | 51 | 75 | 84 | 59 | 50 |
| inches | 1.6 | 1.3 | 1.9 | 2 | 2.2 | 1.6 | 1 | 2 | 3 | 3.3 | 2.3 | 2 |
| Rainy days | 13 | 11 | 12 | 11 | 11 | 8 | 5 | 8 | 9 | 11 | 11 | 12 |
Average annual rainfall in Barcelona: 656.1mm (258.3 inches)
Average daily sunshine
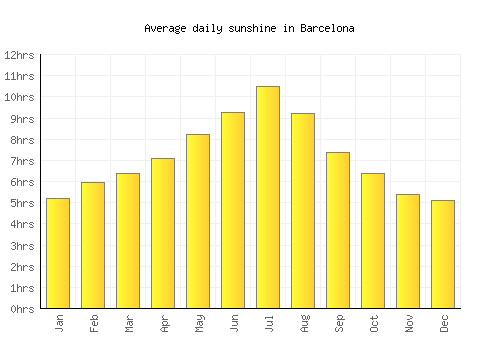
The bar chart below shows the average daily sunshine hours in Barcelona
| Jan | Feb | Mar | Apr | May | Jun | Jul | Aug | Sep | Oct | Nov | Dec | |
|---|---|---|---|---|---|---|---|---|---|---|---|---|
| Hrs sunshine | 5.2 | 6 | 6.4 | 7.1 | 8.2 | 9.3 | 10.5 | 9.2 | 7.3 | 6.4 | 5.4 | 5.1 |
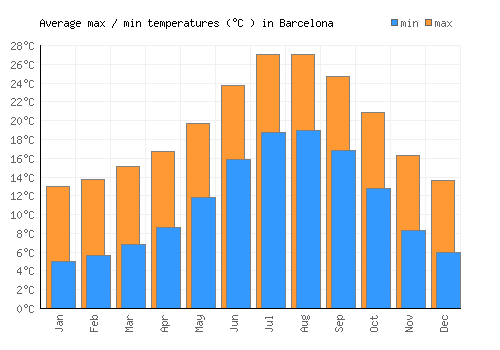
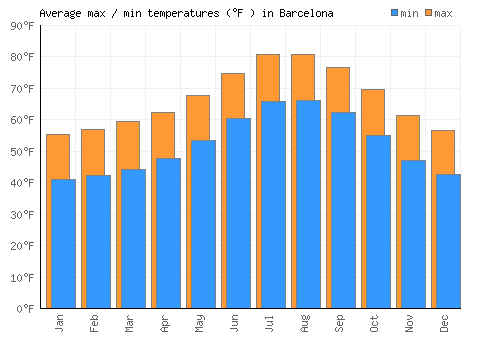
Day / night temperatures
The graph below shows the daily range of temperatures for each month.
| Jan | Feb | Mar | Apr | May | Jun | Jul | Aug | Sep | Oct | Nov | Dec | |
|---|---|---|---|---|---|---|---|---|---|---|---|---|
| Min °C | 5.1 | 5.7 | 6.9 | 8.7 | 11.9 | 15.9 | 18.8 | 19 | 16.9 | 12.8 | 8.4 | 6 |
| Max °C | 13 | 13.8 | 15.2 | 16.8 | 19.8 | 23.8 | 27.1 | 27 | 24.8 | 20.9 | 16.3 | 13.7 |
| Min °F | 41.1 | 42.2 | 44.3 | 47.6 | 53.3 | 60.5 | 65.8 | 66.2 | 62.3 | 55 | 47 | 42.7 |
| Max °F | 48.2 | 49.5 | 51.8 | 54.9 | 60.4 | 67.6 | 73.2 | 73.4 | 69.4 | 62.2 | 54.1 | 49.6 |
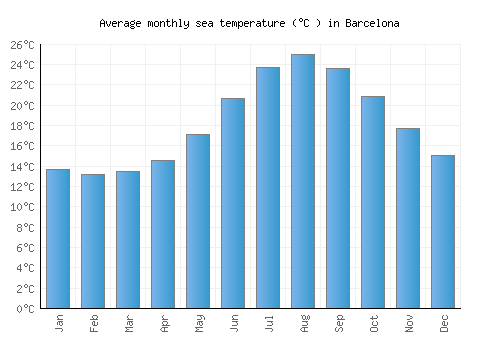
Sea temperature
The graph below shows the average sea temperature.

| Jan | Feb | Mar | Apr | May | Jun | Jul | Aug | Sep | Oct | Nov | Dec | |
|---|---|---|---|---|---|---|---|---|---|---|---|---|
| °C | 13.7 | 13.2 | 13.5 | 14.6 | 17.1 | 20.7 | 23.7 | 25 | 23.6 | 20.9 | 17.7 | 15 |
| °F | 56.6 | 55.7 | 56.3 | 58.2 | 62.9 | 69.2 | 74.6 | 77 | 74.5 | 69.6 | 63.8 | 59 |
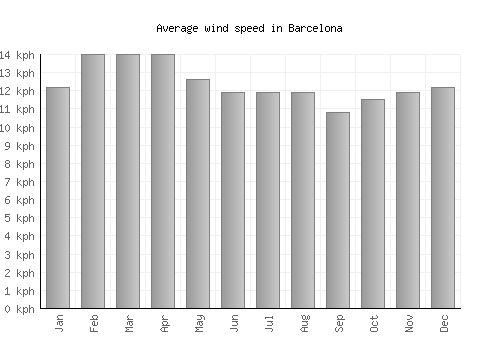
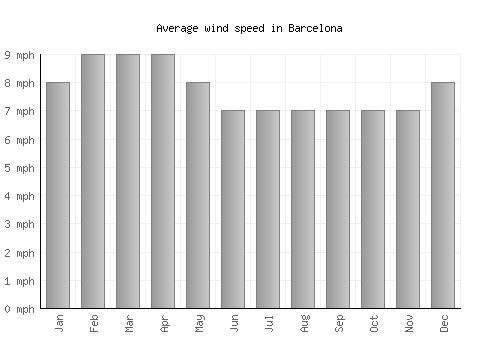
Wind speed
The graph below shows the average wind speed.
| Jan | Feb | Mar | Apr | May | Jun | Jul | Aug | Sep | Oct | Nov | Dec | |
|---|---|---|---|---|---|---|---|---|---|---|---|---|
| km/h | 12 | 14 | 14 | 14 | 13 | 12 | 12 | 12 | 11 | 12 | 12 | 12 |
| mph | 8 | 9 | 9 | 9 | 8 | 7 | 7 | 7 | 7 | 7 | 7 | 8 |
A monthly average windspeed of over 16km/h or 10mph suggests a location is fairly windy.
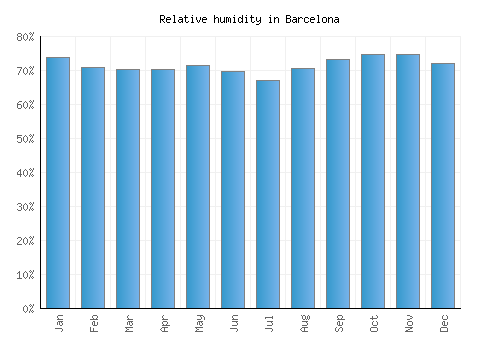
Relative humidity
The graph below shows the average relative humidity.
| Jan | Feb | Mar | Apr | May | Jun | Jul | Aug | Sep | Oct | Nov | Dec |
|---|---|---|---|---|---|---|---|---|---|---|---|
| 74% | 71% | 70% | 70% | 72% | 70% | 67% | 71% | 73% | 75% | 75% | 72% |

Other monthly averages
Barcelona weather stats
| Hottest month: | August | 26.8°C 80.2°F |
|---|---|---|
| Driest month: | July | 25mm 1ins |
| Sunniest month: | July | 10.5hrs |
| Coldest month: | January | 12.8°C 55°F |
| Wettest month: | October | 84mm 3.3ins |
| Warmest sea: | August | 25°C 77°F |

Locations nearby
Top Spain locations
- A Coruña
- Alcúdia
- Alicante
- Almería
- Barcelona
- Benidorm
- Cadiz
- Corralejo
- Girona
- Ibiza
- Las Palmas de Gran Canaria
- Madrid
- Málaga
- Marbella
- Murcia
- Palma
- Playa Blanca
- Playa de las Américas
- Playa del Ingles
- Salou
- San Sebastián
- Santiago de Compostela
- Tarragona
- Torremolinos
- Valencia