Benidorm monthly weather averages
What's the weather like in Benidorm?
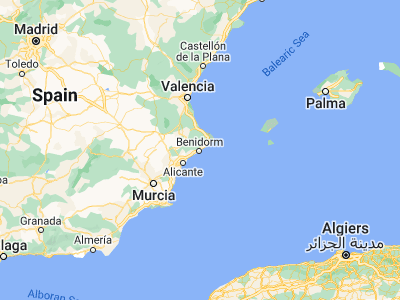
Benidorm, located in the Spanish region of Valencia on the Costa Brava, enjoys a warm Mediterranean climate all year round. Summers are hot and humid, with temperatures averaging around 28°C (82°F) during the day often with a cool breeze coming off the sea to cool things down. Winters are generally mild with temperatures ranging between 8-14°C (46-57°F).
Rainfall is fairly light throughout the year and temperatures rarely dropping below freezing. The average annual rainfall is a very modest 500mm (19.7 inches). The region receives the most rain in October and November.
The Costa Brava is known for its warm and sunny weather, making it a popular destination for holidaymakers. In the summer months, temperatures can easily reach up to 30°C (86°F) and the sea is usually calm. The city is also known for its crystal clear waters, making it a great spot for snorkelling and other water sports.
Thanks to its mild climate, Benidorm is a popular destination for tourists all year round. Visitors can enjoy a range of activities, from sunbathing on the beach to exploring the city's lively nightlife.
Average daytime temperature
The bar chart below shows the average monthly peak daytime temperatures at Benidorm
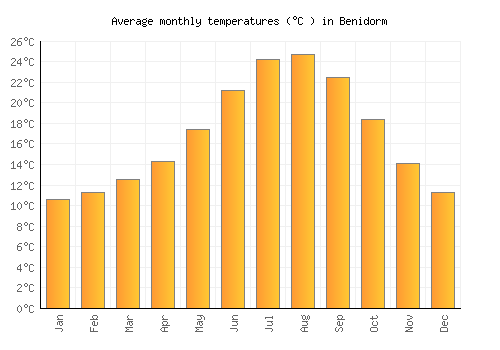
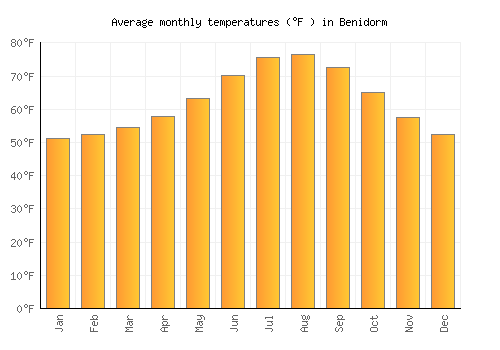
| Jan | Feb | Mar | Apr | May | Jun | Jul | Aug | Sep | Oct | Nov | Dec | |
|---|---|---|---|---|---|---|---|---|---|---|---|---|
| °C | 15.1 | 15.9 | 17.4 | 19.1 | 22.2 | 26 | 29.1 | 29.4 | 27.4 | 23.1 | 18.5 | 15.6 |
| °F | 59.2 | 60.7 | 63.3 | 66.4 | 71.9 | 78.7 | 84.3 | 84.9 | 81.2 | 73.5 | 65.4 | 60.1 |
Please note: these are the average peak daytime temperatures (usually around mid-afternoon) so do not show daytime / night highs and lows. To see the daily range of temperatures have a look at the temperature max / min chart below.
Average rainfall & rainy days
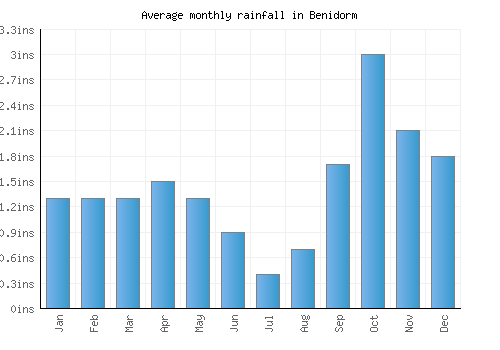
The graph below shows the average rainfall and number of rainy days per month.

| Jan | Feb | Mar | Apr | May | Jun | Jul | Aug | Sep | Oct | Nov | Dec | |
|---|---|---|---|---|---|---|---|---|---|---|---|---|
| mm | 32 | 33 | 34 | 38 | 32 | 22 | 10 | 18 | 42 | 76 | 53 | 45 |
| inches | 1.3 | 1.3 | 1.3 | 1.5 | 1.3 | 0.9 | 0.4 | 0.7 | 1.7 | 3 | 2.1 | 1.8 |
| Rainy days | 13 | 11 | 11 | 10 | 9 | 6 | 3 | 4 | 6 | 10 | 10 | 12 |
Average annual rainfall in Benidorm: 473.4mm (186.4 inches)
Average daily sunshine
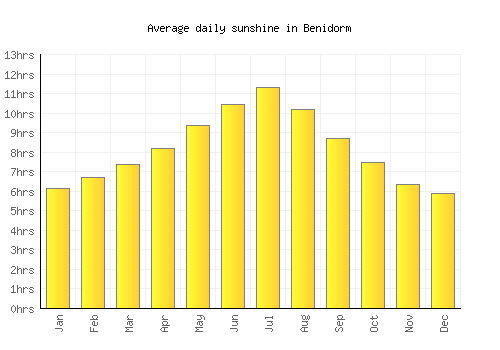
The bar chart below shows the average daily sunshine hours in Benidorm
| Jan | Feb | Mar | Apr | May | Jun | Jul | Aug | Sep | Oct | Nov | Dec | |
|---|---|---|---|---|---|---|---|---|---|---|---|---|
| Hrs sunshine | 6.1 | 6.7 | 7.3 | 8.2 | 9.4 | 10.4 | 11.3 | 10.2 | 8.7 | 7.5 | 6.3 | 5.9 |
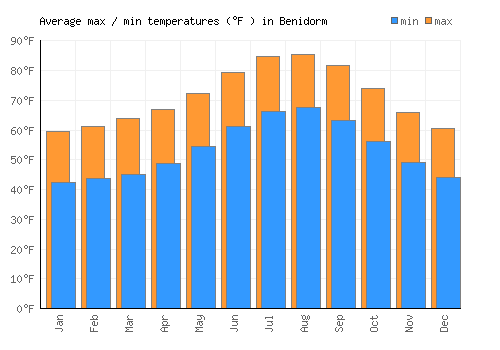
Day / night temperatures
The graph below shows the daily range of temperatures for each month.
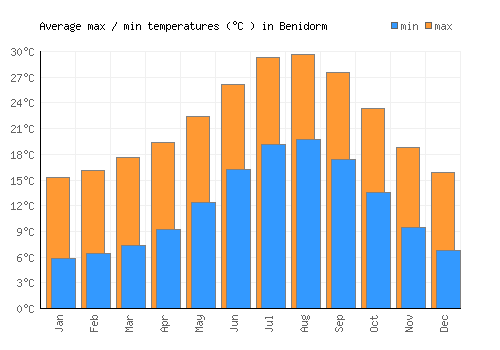
| Jan | Feb | Mar | Apr | May | Jun | Jul | Aug | Sep | Oct | Nov | Dec | |
|---|---|---|---|---|---|---|---|---|---|---|---|---|
| Min °C | 5.9 | 6.5 | 7.4 | 9.3 | 12.4 | 16.2 | 19.1 | 19.8 | 17.4 | 13.5 | 9.5 | 6.8 |
| Max °C | 15.4 | 16.2 | 17.7 | 19.4 | 22.4 | 26.2 | 29.3 | 29.7 | 27.6 | 23.3 | 18.8 | 15.9 |
| Min °F | 42.5 | 43.6 | 45.2 | 48.7 | 54.3 | 61.2 | 66.4 | 67.6 | 63.3 | 56.3 | 49 | 44.2 |
| Max °F | 51.1 | 52.3 | 54.5 | 57.7 | 63.3 | 70.2 | 75.6 | 76.5 | 72.5 | 65.1 | 57.4 | 52.3 |
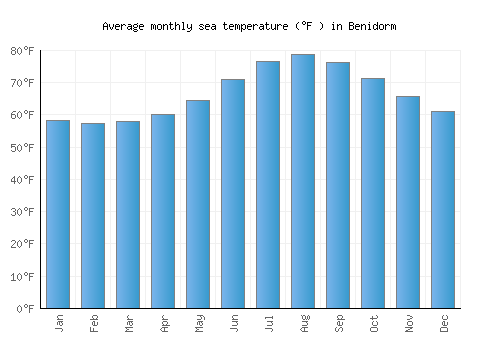
Sea temperature
The graph below shows the average sea temperature.
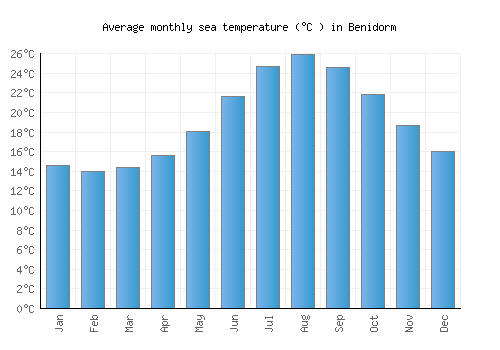
| Jan | Feb | Mar | Apr | May | Jun | Jul | Aug | Sep | Oct | Nov | Dec | |
|---|---|---|---|---|---|---|---|---|---|---|---|---|
| °C | 14.6 | 14 | 14.4 | 15.6 | 18 | 21.6 | 24.7 | 25.9 | 24.6 | 21.8 | 18.7 | 16 |
| °F | 58.2 | 57.2 | 57.9 | 60.2 | 64.5 | 71 | 76.5 | 78.7 | 76.2 | 71.2 | 65.7 | 60.9 |
Wind speed
The graph below shows the average wind speed.
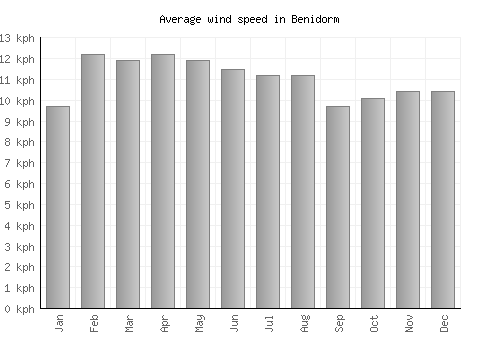
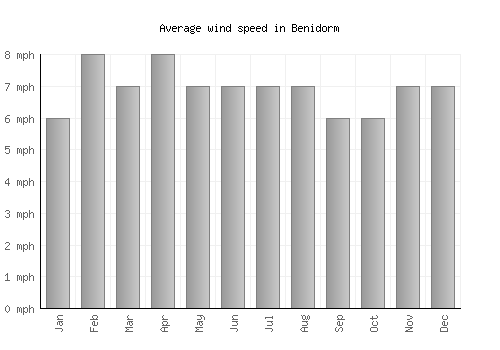
| Jan | Feb | Mar | Apr | May | Jun | Jul | Aug | Sep | Oct | Nov | Dec | |
|---|---|---|---|---|---|---|---|---|---|---|---|---|
| km/h | 10 | 12 | 12 | 12 | 12 | 12 | 11 | 11 | 10 | 10 | 10 | 10 |
| mph | 6 | 8 | 7 | 8 | 7 | 7 | 7 | 7 | 6 | 6 | 7 | 7 |
A monthly average windspeed of over 16km/h or 10mph suggests a location is fairly windy.
Relative humidity
The graph below shows the average relative humidity.
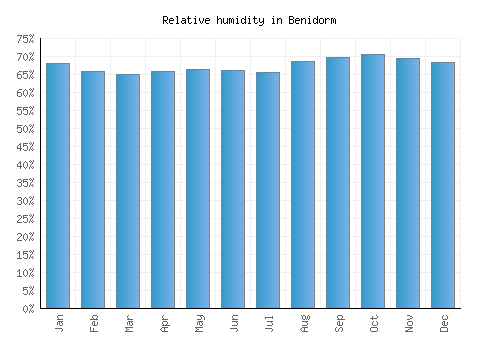
| Jan | Feb | Mar | Apr | May | Jun | Jul | Aug | Sep | Oct | Nov | Dec |
|---|---|---|---|---|---|---|---|---|---|---|---|
| 68% | 66% | 65% | 66% | 66% | 66% | 66% | 69% | 70% | 71% | 69% | 69% |
Other monthly averages
Benidorm weather stats
| Hottest month: | August | 29.4°C 84.9°F |
|---|---|---|
| Driest month: | July | 10mm 0.4ins |
| Sunniest month: | July | 11.3hrs |
| Coldest month: | January | 15.1°C 59.2°F |
| Wettest month: | October | 76mm 3ins |
| Warmest sea: | August | 25.9°C 78.6°F |

Locations nearby
Top Spain locations
- A Coruña
- Alcúdia
- Alicante
- Almería
- Barcelona
- Benidorm
- Cadiz
- Corralejo
- Girona
- Ibiza
- Las Palmas de Gran Canaria
- Madrid
- Málaga
- Marbella
- Murcia
- Palma
- Playa Blanca
- Playa de las Américas
- Playa del Ingles
- Salou
- San Sebastián
- Santiago de Compostela
- Tarragona
- Torremolinos
- Valencia