Ronda monthly weather averages
Average daytime temperature
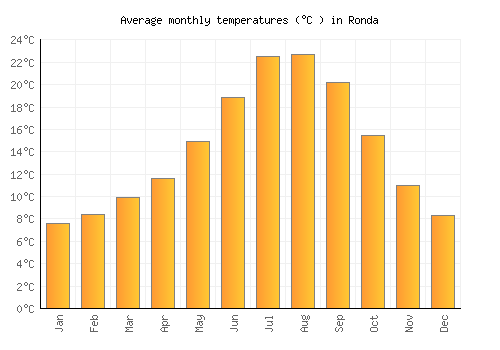
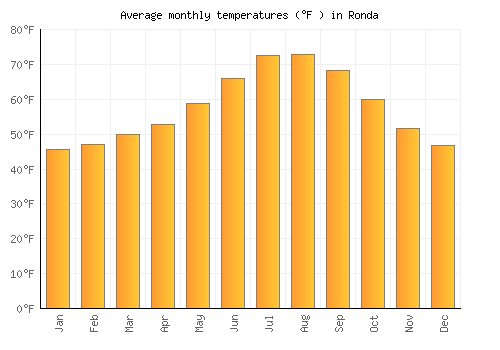
The bar chart below shows the average monthly peak daytime temperatures at Ronda
| Jan | Feb | Mar | Apr | May | Jun | Jul | Aug | Sep | Oct | Nov | Dec | |
|---|---|---|---|---|---|---|---|---|---|---|---|---|
| °C | 11.4 | 12.4 | 14.5 | 16.3 | 20.2 | 24.7 | 29 | 29 | 25.7 | 20.1 | 15 | 12 |
| °F | 52.5 | 54.2 | 58 | 61.4 | 68.4 | 76.5 | 84.2 | 84.2 | 78.3 | 68.2 | 58.9 | 53.6 |
Please note: these are the average peak daytime temperatures (usually around mid-afternoon) so do not show daytime / night highs and lows. To see the daily range of temperatures have a look at the temperature max / min chart below.
Average rainfall & rainy days
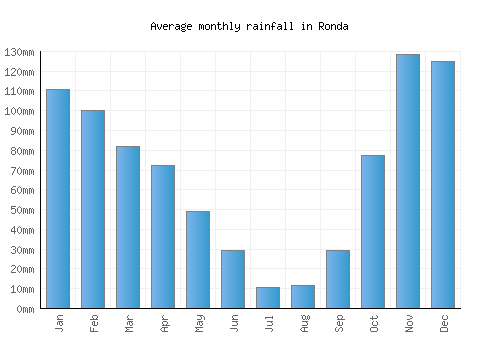
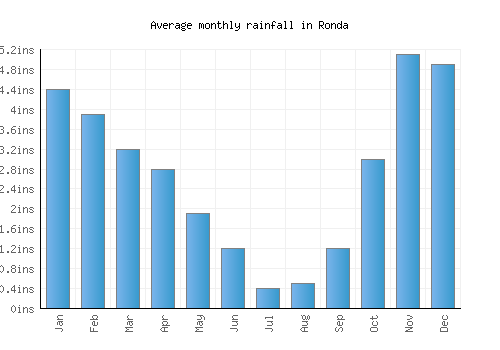
The graph below shows the average rainfall and number of rainy days per month.
| Jan | Feb | Mar | Apr | May | Jun | Jul | Aug | Sep | Oct | Nov | Dec | |
|---|---|---|---|---|---|---|---|---|---|---|---|---|
| mm | 111 | 100 | 82 | 72 | 49 | 30 | 11 | 12 | 30 | 77 | 128 | 125 |
| inches | 4.4 | 3.9 | 3.2 | 2.8 | 1.9 | 1.2 | 0.4 | 0.5 | 1.2 | 3 | 5.1 | 4.9 |
| Rainy days | 14 | 13 | 12 | 12 | 9 | 6 | 3 | 3 | 5 | 10 | 13 | 14 |
Average annual rainfall in Ronda: 857.1mm (337.4 inches)
Average daily sunshine
The bar chart below shows the average daily sunshine hours in Ronda
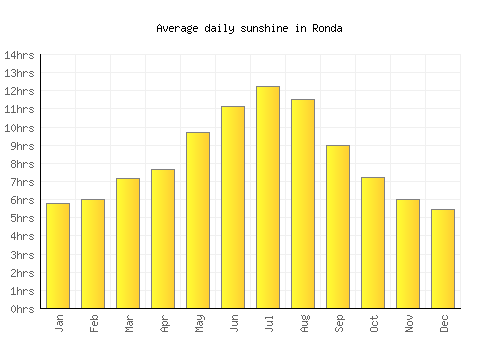
| Jan | Feb | Mar | Apr | May | Jun | Jul | Aug | Sep | Oct | Nov | Dec | |
|---|---|---|---|---|---|---|---|---|---|---|---|---|
| Hrs sunshine | 5.8 | 6 | 7.1 | 7.7 | 9.7 | 11.1 | 12.2 | 11.5 | 9 | 7.2 | 6 | 5.5 |
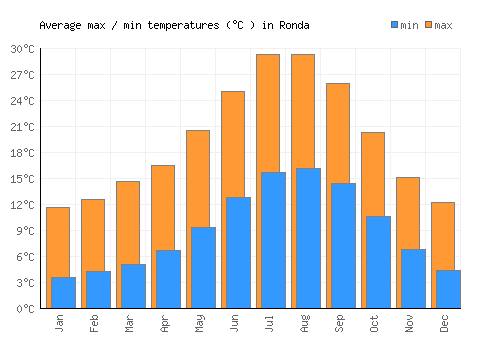
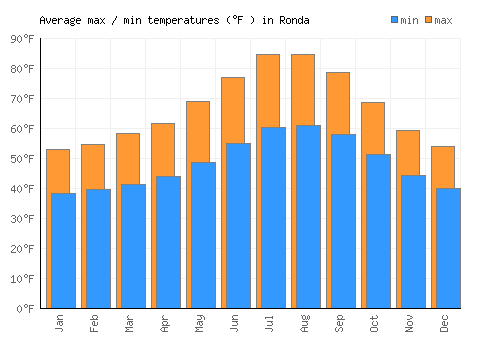
Day / night temperatures
The graph below shows the daily range of temperatures for each month.
| Jan | Feb | Mar | Apr | May | Jun | Jul | Aug | Sep | Oct | Nov | Dec | |
|---|---|---|---|---|---|---|---|---|---|---|---|---|
| Min °C | 3.6 | 4.3 | 5.1 | 6.7 | 9.3 | 12.8 | 15.7 | 16.1 | 14.4 | 10.7 | 6.9 | 4.4 |
| Max °C | 11.6 | 12.6 | 14.7 | 16.6 | 20.5 | 25 | 29.3 | 29.3 | 26 | 20.4 | 15.2 | 12.2 |
| Min °F | 38.5 | 39.7 | 41.2 | 44 | 48.7 | 55 | 60.3 | 61 | 57.9 | 51.2 | 44.3 | 39.9 |
| Max °F | 45.7 | 47.1 | 49.8 | 52.9 | 58.8 | 66 | 72.5 | 72.9 | 68.4 | 59.9 | 51.8 | 46.9 |
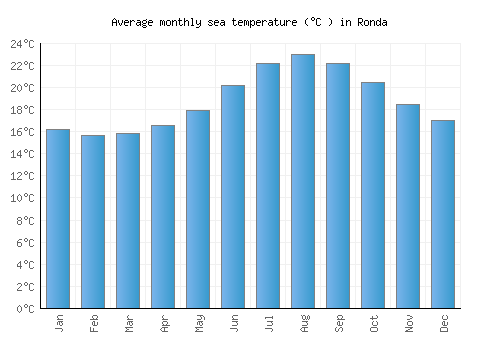
Sea temperature
The graph below shows the average sea temperature.
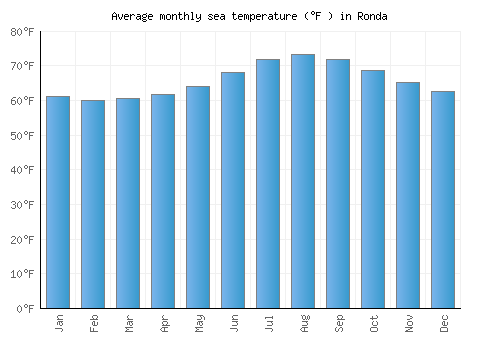
| Jan | Feb | Mar | Apr | May | Jun | Jul | Aug | Sep | Oct | Nov | Dec | |
|---|---|---|---|---|---|---|---|---|---|---|---|---|
| °C | 16.1 | 15.6 | 15.8 | 16.5 | 17.9 | 20.1 | 22.2 | 23 | 22.1 | 20.4 | 18.5 | 17 |
| °F | 61.1 | 60.1 | 60.5 | 61.8 | 64.2 | 68.2 | 71.9 | 73.3 | 71.9 | 68.8 | 65.2 | 62.6 |
Wind speed
The graph below shows the average wind speed.
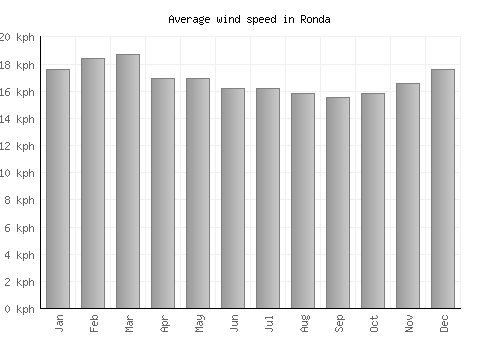
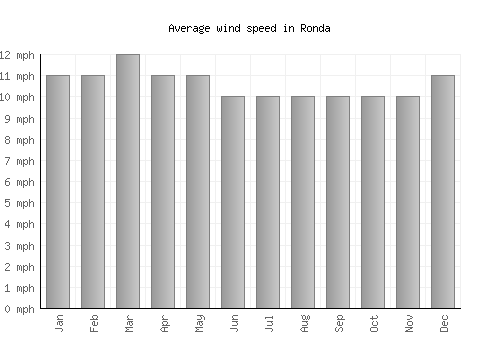
| Jan | Feb | Mar | Apr | May | Jun | Jul | Aug | Sep | Oct | Nov | Dec | |
|---|---|---|---|---|---|---|---|---|---|---|---|---|
| km/h | 18 | 18 | 19 | 17 | 17 | 16 | 16 | 16 | 16 | 16 | 17 | 18 |
| mph | 11 | 11 | 12 | 11 | 11 | 10 | 10 | 10 | 10 | 10 | 10 | 11 |
A monthly average windspeed of over 16km/h or 10mph suggests a location is fairly windy.
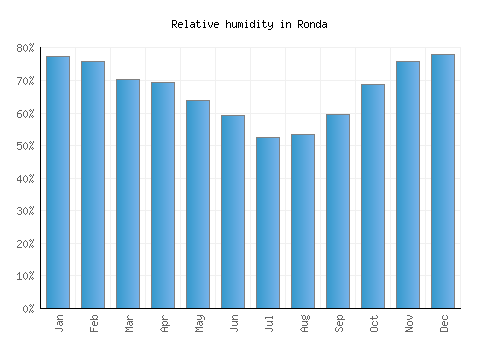
Relative humidity
The graph below shows the average relative humidity.
| Jan | Feb | Mar | Apr | May | Jun | Jul | Aug | Sep | Oct | Nov | Dec |
|---|---|---|---|---|---|---|---|---|---|---|---|
| 77% | 76% | 70% | 69% | 64% | 59% | 52% | 53% | 60% | 69% | 76% | 78% |

Other monthly averages
Ronda weather stats
| Hottest month: | August | 29°C 84.2°F |
|---|---|---|
| Driest month: | July | 11mm 0.4ins |
| Sunniest month: | July | 12.2hrs |
| Coldest month: | January | 11.4°C 52.5°F |
| Wettest month: | November | 128mm 5ins |
| Warmest sea: | August | 23°C 73.4°F |

Locations nearby
Top Spain locations
- A Coruña
- Alcúdia
- Alicante
- Almería
- Barcelona
- Benidorm
- Cadiz
- Corralejo
- Girona
- Ibiza
- Las Palmas de Gran Canaria
- Madrid
- Málaga
- Marbella
- Murcia
- Palma
- Playa Blanca
- Playa de las Américas
- Playa del Ingles
- Salou
- San Sebastián
- Santiago de Compostela
- Tarragona
- Torremolinos
- Valencia