Guernica Weather in November
What's the weather like in Guernica (Buenos Aires) in November 2025?
The climate in Guernica during November can be summarized as warm and a little damp.
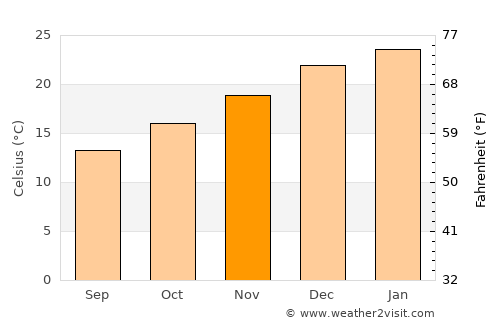
November is in the spring in Guernica and is typically the 5th warmest month of the year. Daytime maximum temperatures average around 25°C (76°F), whilst at night 13°C (56°F) is normal.
| Daytime temperature | 24.7°C 76.4°F |
|---|---|
| Nightly temperature | 13.2°C 55.7°F |
| Average temperature | 18.9°C 66°F |
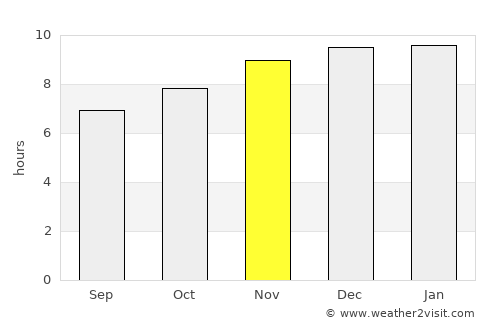
| Daily sunshine | 9 hrs |
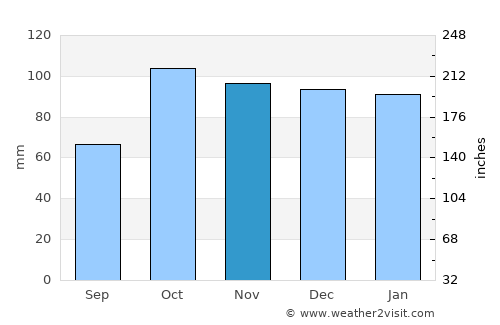
| Avg rainfall | 96 mm 3.8 ins |
| Rainy days | 9 days |
| Sea temperature | 18.1°C 64.6°F |
| Humidity | 70% |
| Windspeed | 14.8kph 9 mph |
On average November is the 4th wettest month of the year in Guernica with around 96mm 3.8 inches of rain making it a a little damp time to visit. This rainfall is typically spread over 9 days, although this may vary considerably.
On the flip side this corresponds to an average of 9 hours of sunshine per day.
November temperatures in Guernica
November rainfall
November hourly sunshine
The data used in these monthly averages covers a period of over 100 years right up until last year. As such they are a valid prediction of what to expect for the weather in Guernica in November 2025.
Other monthly averages
Best places to visit in November
Guernica weather stats
| Hottest month: | January | 29.4°C 84.9°F |
|---|---|---|
| Driest month: | June | 53mm 2.1ins |
| Sunniest month: | February | 9.4hrs |
| Coldest month: | July | 14.6°C 58.3°F |
| Wettest month: | March | 113mm 4.4ins |