Sant Andreu de la Barca Weather in October
What's the weather like in Sant Andreu de la Barca (Catalonia) in October 2025?
The climate in Sant Andreu de la Barca during October can be summarized as mild and a little damp.
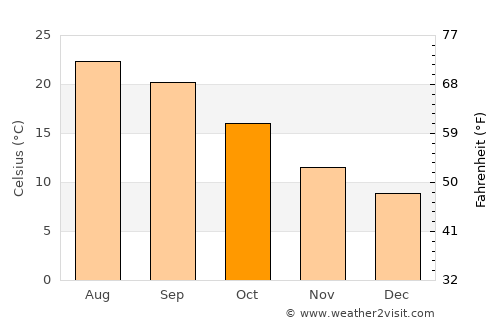
October is in the fall / autumn in Sant Andreu de la Barca and is typically the 5th warmest month of the year. Daytime maximum temperatures average around 20°C (68°F), whilst at night 12°C (53°F) is normal.
| Daytime temperature | 20.2°C 68.3°F |
|---|---|
| Nightly temperature | 11.9°C 53.3°F |
| Average temperature | 16°C 60.8°F |
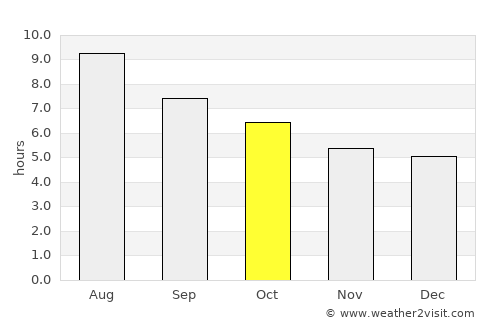
| Daily sunshine | 6.4 hrs |
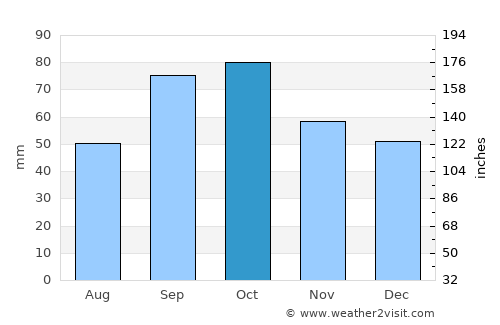
| Avg rainfall | 80 mm 3.2 ins |
| Rainy days | 11 days |
| Sea temperature | 21.3°C 70.4°F |
| Humidity | 74% |
| Windspeed | 11.5kph 7 mph |
On average October is the wettest month of the year in Sant Andreu de la Barca with around 80mm 3.2 inches of rain making it a a little damp time to visit. This rainfall is typically spread over 11 days, although this may vary considerably.
On the flip side this corresponds to an average of 6.4 hours of sunshine per day.
October temperatures in Sant Andreu de la Barca
October rainfall
October hourly sunshine
The data used in these monthly averages covers a period of over 100 years right up until last year. As such they are a valid prediction of what to expect for the weather in Sant Andreu de la Barca in October 2025.
Other monthly averages
Best places to visit in October
Sant Andreu de la Barca weather stats
| Hottest month: | July | 26.5°C 79.7°F |
|---|---|---|
| Driest month: | July | 25mm 1ins |
| Sunniest month: | July | 10.6hrs |
| Coldest month: | January | 11.9°C 53.4°F |
| Wettest month: | October | 80mm 3.1ins |

Locations nearby
Top Spain locations
- A Coruña
- Alcúdia
- Alicante
- Almería
- Barcelona
- Benidorm
- Cadiz
- Corralejo
- Girona
- Ibiza
- Las Palmas de Gran Canaria
- Madrid
- Málaga
- Marbella
- Murcia
- Palma
- Playa Blanca
- Playa de las Américas
- Playa del Ingles
- Salou
- San Sebastián
- Santiago de Compostela
- Tarragona
- Torremolinos
- Valencia