Chicago (IL) monthly weather averages
What's the weather like in Chicago?
Nicknamed the 'Windy city' Chicago is a city known for its wide range of weather, from hot and humid summers to cold and icy winters. The climate in Chicago is classified as a humid continental climate, which means that the area experiences hot, humid summers and cold, dry winters.
Summer in Chicago is typically hot and humid, with temperatures often reaching into the upper 80s (30°C) and 90s (34°C). Rainfall is usually frequent during these months, and thunderstorms are common. Spring and fall are typically mild, with temperatures in the mid-60s (18°C) to mid-70s (23°C).
Winter in Chicago is cold, with temperatures often falling below freezing. Snowfall is common, and the city can get anywhere from 20 (50cm) to 40 inches (100cm) of snow each season. The lake-effect snow from Lake Michigan can also add to the snow totals.
Chicago's climate is affected by the lake, with lake breezes cooling things off in the summer and moderating temperatures in the winter. And yes, as the nickname suggests, Chicago also experiences a lot of wind, which can make the winter months seem even colder.
Average daytime temperature
The bar chart below shows the average monthly peak daytime temperatures at Chicago
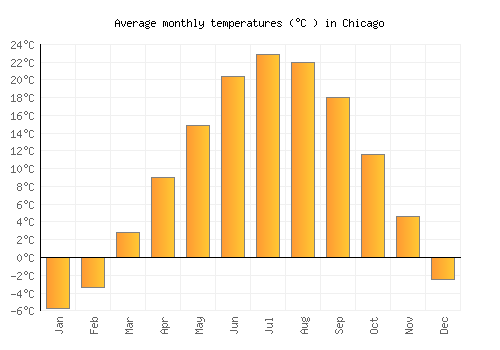
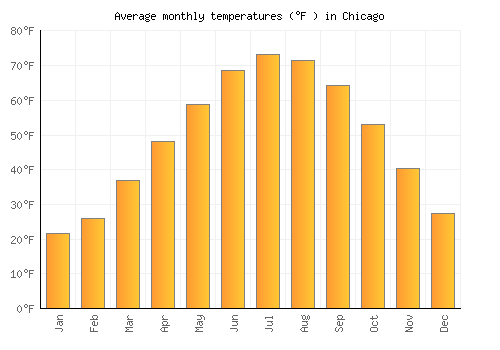
| Jan | Feb | Mar | Apr | May | Jun | Jul | Aug | Sep | Oct | Nov | Dec | |
|---|---|---|---|---|---|---|---|---|---|---|---|---|
| °C | -1.4 | 1 | 7.4 | 14.3 | 20.8 | 26.3 | 28.3 | 27.3 | 23.3 | 16.9 | 8.8 | 1.5 |
| °F | 29.5 | 33.8 | 45.4 | 57.8 | 69.4 | 79.3 | 83 | 81.1 | 74 | 62.4 | 47.8 | 34.6 |
Please note: these are the average peak daytime temperatures (usually around mid-afternoon) so do not show daytime / night highs and lows. To see the daily range of temperatures have a look at the temperature max / min chart below.
Average rainfall & rainy days
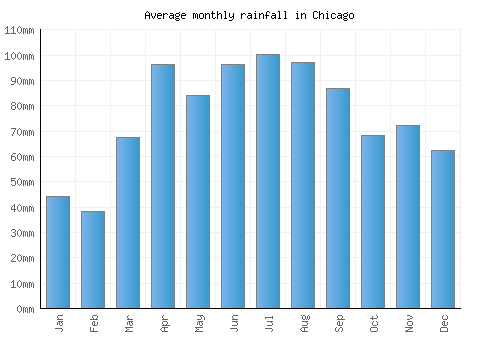
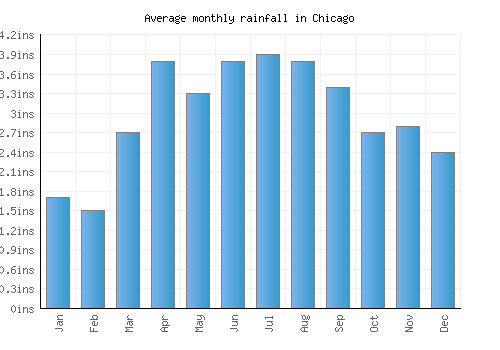
The graph below shows the average rainfall and number of rainy days per month.
| Jan | Feb | Mar | Apr | May | Jun | Jul | Aug | Sep | Oct | Nov | Dec | |
|---|---|---|---|---|---|---|---|---|---|---|---|---|
| mm | 44 | 38 | 68 | 96 | 84 | 96 | 100 | 97 | 87 | 68 | 72 | 62 |
| inches | 1.7 | 1.5 | 2.7 | 3.8 | 3.3 | 3.8 | 3.9 | 3.8 | 3.4 | 2.7 | 2.8 | 2.4 |
| Rainy days | 12 | 10 | 13 | 13 | 11 | 10 | 10 | 9 | 9 | 9 | 11 | 12 |
Average annual rainfall in Chicago: 867.634mm (341.6 inches)
Average daily sunshine
The bar chart below shows the average daily sunshine hours in Chicago
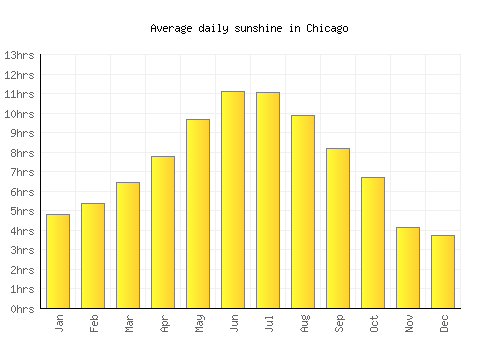
| Jan | Feb | Mar | Apr | May | Jun | Jul | Aug | Sep | Oct | Nov | Dec | |
|---|---|---|---|---|---|---|---|---|---|---|---|---|
| Hrs sunshine | 4.8 | 5.4 | 6.5 | 7.8 | 9.7 | 11.1 | 11 | 9.9 | 8.2 | 6.7 | 4.2 | 3.8 |
Day / night temperatures
The graph below shows the daily range of temperatures for each month.
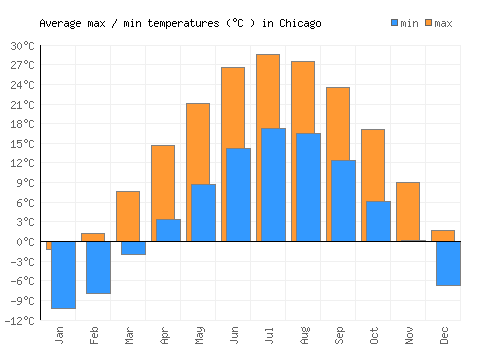
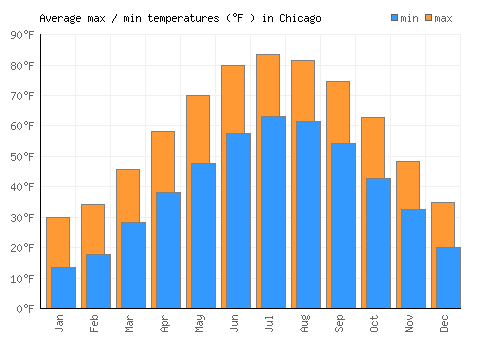
| Jan | Feb | Mar | Apr | May | Jun | Jul | Aug | Sep | Oct | Nov | Dec | |
|---|---|---|---|---|---|---|---|---|---|---|---|---|
| Min °C | -10.2 | -8 | -2.1 | 3.4 | 8.8 | 14.2 | 17.2 | 16.5 | 12.4 | 6.1 | 0.2 | -6.7 |
| Max °C | -1.2 | 1.2 | 7.7 | 14.6 | 21.1 | 26.6 | 28.6 | 27.6 | 23.6 | 17.2 | 9 | 1.7 |
| Min °F | 13.6 | 17.6 | 28.3 | 38.1 | 47.8 | 57.6 | 63 | 61.6 | 54.3 | 42.9 | 32.4 | 20 |
| Max °F | 21.7 | 25.9 | 37 | 48.2 | 58.8 | 68.7 | 73.2 | 71.6 | 64.4 | 52.9 | 40.3 | 27.5 |
Sea temperature
The graph below shows the average sea temperature.
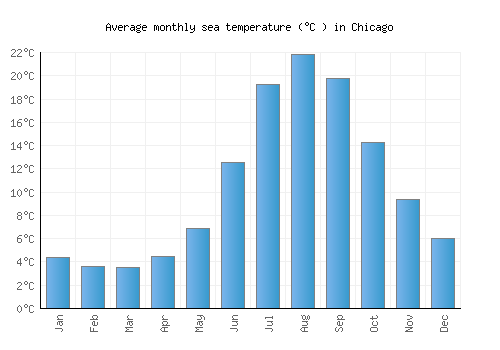
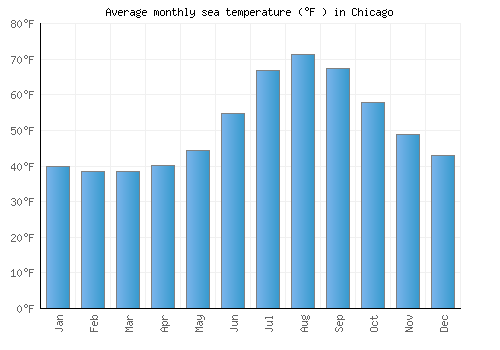
| Jan | Feb | Mar | Apr | May | Jun | Jul | Aug | Sep | Oct | Nov | Dec | |
|---|---|---|---|---|---|---|---|---|---|---|---|---|
| °C | 4.4 | 3.6 | 3.5 | 4.5 | 6.9 | 12.5 | 19.3 | 21.8 | 19.7 | 14.3 | 9.4 | 6 |
| °F | 39.9 | 38.5 | 38.4 | 40.1 | 44.4 | 54.6 | 66.7 | 71.3 | 67.5 | 57.7 | 48.9 | 42.9 |
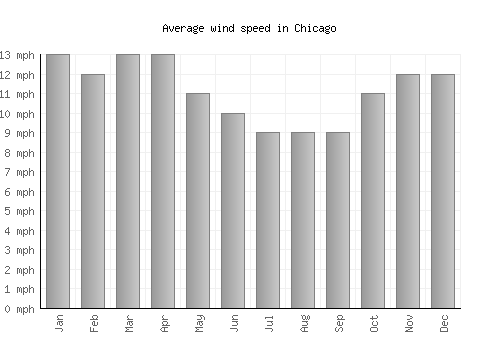
Wind speed
The graph below shows the average wind speed.
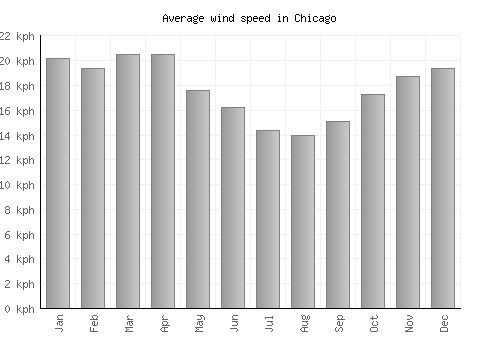
| Jan | Feb | Mar | Apr | May | Jun | Jul | Aug | Sep | Oct | Nov | Dec | |
|---|---|---|---|---|---|---|---|---|---|---|---|---|
| km/h | 20 | 19 | 21 | 21 | 18 | 16 | 14 | 14 | 15 | 17 | 19 | 19 |
| mph | 13 | 12 | 13 | 13 | 11 | 10 | 9 | 9 | 9 | 11 | 12 | 12 |
A monthly average windspeed of over 16km/h or 10mph suggests a location is fairly windy.
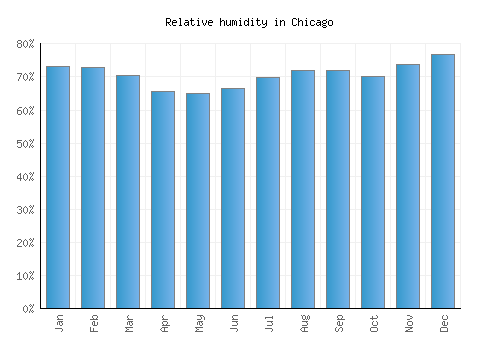
Relative humidity
The graph below shows the average relative humidity.
| Jan | Feb | Mar | Apr | May | Jun | Jul | Aug | Sep | Oct | Nov | Dec |
|---|---|---|---|---|---|---|---|---|---|---|---|
| 73% | 73% | 70% | 66% | 65% | 67% | 70% | 72% | 72% | 70% | 74% | 77% |
Other monthly averages
Chicago weather stats
| Hottest month: | July | 28.3°C 82.9°F |
|---|---|---|
| Driest month: | February | 38mm 1.5ins |
| Sunniest month: | July | 11hrs |
| Coldest month: | January | -1.4°C 29.5°F |
| Wettest month: | July | 100mm 3.9ins |
| Warmest sea: | August | 21.8°C 71.2°F |

Locations nearby
Top United States locations
- Anaheim
- Anchorage
- Aspen
- Atlanta
- Boston
- Breckenridge
- Charleston
- Chicago
- Coney Island
- Dallas
- Death Valley
- Denver
- Destin
- Detroit
- Glacier National Park
- Grand Canyon
- Honolulu
- Houston
- Indianapolis
- Key West
- Lake Tahoe
- Las Vegas
- Los Angeles
- Malibu
- Manhattan
- Memphis
- Miami
- Minneapolis
- Myrtle Beach
- New Orleans
- New York City
- Niagara Falls
- Ocean City
- Orlando
- Palm Springs
- Philadelphia
- Phoenix
- Salt Lake City
- San Diego
- San Francisco
- Scottsdale
- Seattle
- Sedona
- Sonoma
- Washington, D. C.
- Yosemite National Park
- Zion National Park