New Orleans (LA) monthly weather averages
What's the weather like in New Orleans?
New Orleans has a humid subtropical climate, which is characterized by hot, humid summers and mild winters. The climate is heavily influenced by the Gulf of Mexico, which moderates temperatures and provides plenty of moisture. Summers temperatures average around the mid-80s Fahrenheit (30s Celsius) and occasional heat waves produce temperatures well into the 90s Fahrenheit (mid-30s Celsius). Winters are mild, with temperatures usually remaining above freezing and rarely dipping below 50°F (10°C). Snowfall is rare occurence.
Rainfall however is abundant throughout the year, with an average of about 61 inches (155 cm) annually. The wettest months are usually April through June, while October to December tend to be the driest months.
New Orleans also experiences occasional tropical storms and hurricanes, which can bring strong winds, heavy rain and flooding. The hurricane season typically runs from June through November.
Average daytime temperature
The bar chart below shows the average monthly peak daytime temperatures at New Orleans
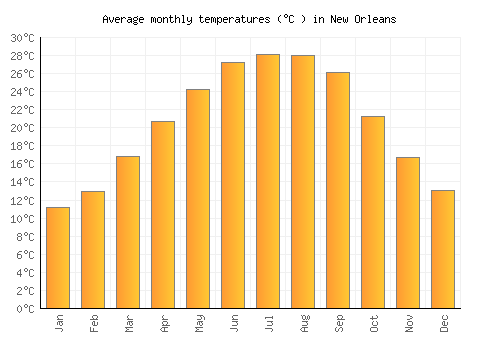
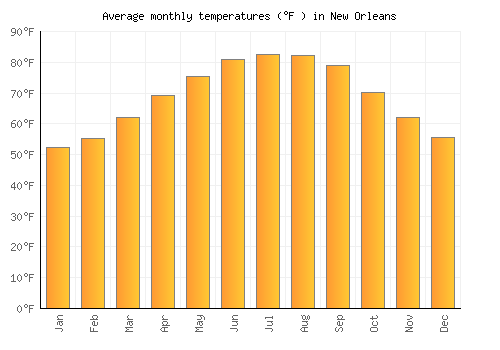
| Jan | Feb | Mar | Apr | May | Jun | Jul | Aug | Sep | Oct | Nov | Dec | |
|---|---|---|---|---|---|---|---|---|---|---|---|---|
| °C | 15.9 | 17.7 | 21.7 | 25.5 | 28.9 | 31.7 | 32.5 | 32.3 | 30.3 | 26.2 | 21.5 | 17.8 |
| °F | 60.6 | 63.8 | 71 | 77.9 | 84 | 89.1 | 90.5 | 90.2 | 86.6 | 79.2 | 70.7 | 64.1 |
Please note: these are the average peak daytime temperatures (usually around mid-afternoon) so do not show daytime / night highs and lows. To see the daily range of temperatures have a look at the temperature max / min chart below.
Average rainfall & rainy days
The graph below shows the average rainfall and number of rainy days per month.
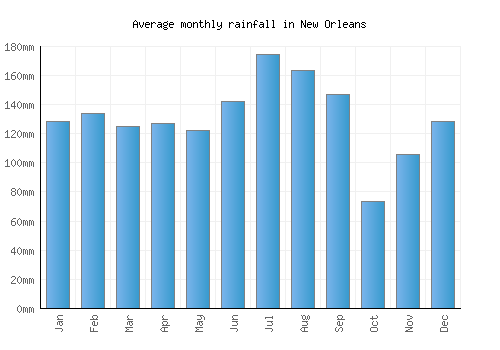

| Jan | Feb | Mar | Apr | May | Jun | Jul | Aug | Sep | Oct | Nov | Dec | |
|---|---|---|---|---|---|---|---|---|---|---|---|---|
| mm | 128 | 134 | 125 | 127 | 122 | 142 | 174 | 163 | 147 | 73 | 106 | 128 |
| inches | 5 | 5.3 | 4.9 | 5 | 4.8 | 5.6 | 6.9 | 6.4 | 5.8 | 2.9 | 4.2 | 5.1 |
| Rainy days | 10 | 9 | 9 | 7 | 8 | 11 | 14 | 14 | 10 | 6 | 8 | 10 |
Average annual rainfall in New Orleans: 1510.234mm (594.6 inches)
Average daily sunshine
The bar chart below shows the average daily sunshine hours in New Orleans
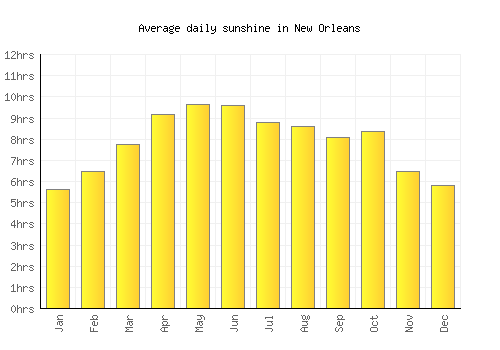
| Jan | Feb | Mar | Apr | May | Jun | Jul | Aug | Sep | Oct | Nov | Dec | |
|---|---|---|---|---|---|---|---|---|---|---|---|---|
| Hrs sunshine | 5.6 | 6.5 | 7.7 | 9.2 | 9.6 | 9.6 | 8.8 | 8.6 | 8.1 | 8.4 | 6.5 | 5.8 |
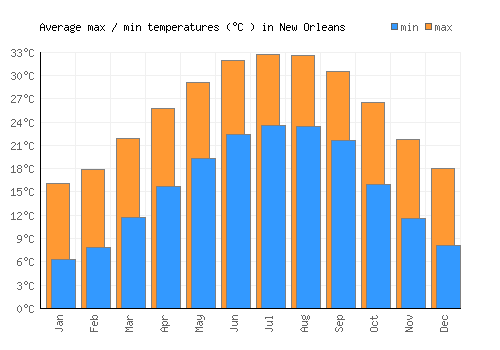
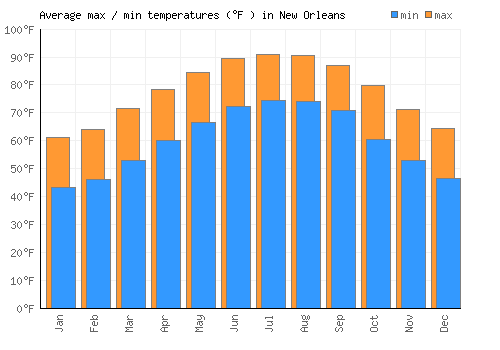
Day / night temperatures
The graph below shows the daily range of temperatures for each month.
| Jan | Feb | Mar | Apr | May | Jun | Jul | Aug | Sep | Oct | Nov | Dec | |
|---|---|---|---|---|---|---|---|---|---|---|---|---|
| Min °C | 6.3 | 7.9 | 11.7 | 15.7 | 19.3 | 22.5 | 23.5 | 23.5 | 21.7 | 15.9 | 11.7 | 8.2 |
| Max °C | 16.2 | 17.9 | 21.9 | 25.8 | 29.1 | 32 | 32.7 | 32.6 | 30.6 | 26.5 | 21.8 | 18.1 |
| Min °F | 43.3 | 46.2 | 53.1 | 60.2 | 66.7 | 72.4 | 74.3 | 74.2 | 71 | 60.6 | 53 | 46.7 |
| Max °F | 52.2 | 55.2 | 62.2 | 69.3 | 75.6 | 81 | 82.6 | 82.4 | 79 | 70.2 | 62.1 | 55.6 |
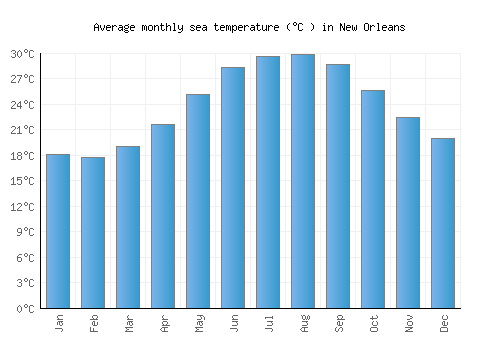
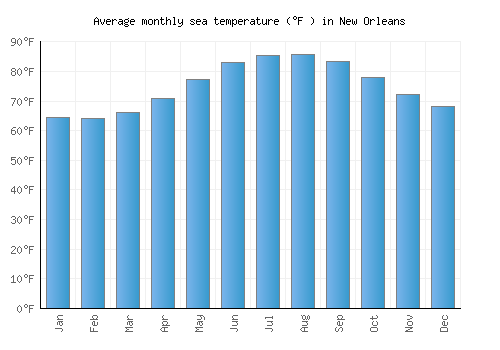
Sea temperature
The graph below shows the average sea temperature.
| Jan | Feb | Mar | Apr | May | Jun | Jul | Aug | Sep | Oct | Nov | Dec | |
|---|---|---|---|---|---|---|---|---|---|---|---|---|
| °C | 18.1 | 17.8 | 19 | 21.6 | 25.1 | 28.3 | 29.6 | 29.8 | 28.6 | 25.6 | 22.4 | 20 |
| °F | 64.6 | 64 | 66.2 | 70.9 | 77.2 | 83 | 85.4 | 85.7 | 83.5 | 78.1 | 72.3 | 68 |
Wind speed
The graph below shows the average wind speed.
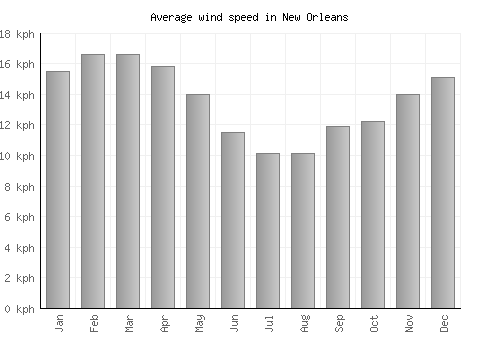
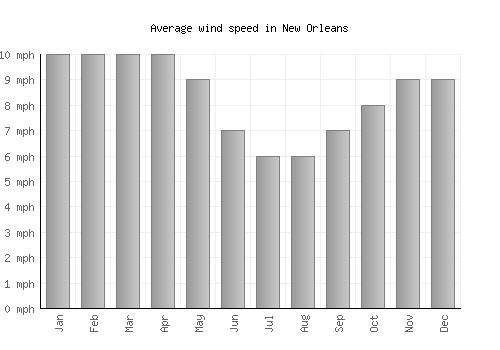
| Jan | Feb | Mar | Apr | May | Jun | Jul | Aug | Sep | Oct | Nov | Dec | |
|---|---|---|---|---|---|---|---|---|---|---|---|---|
| km/h | 16 | 17 | 17 | 16 | 14 | 12 | 10 | 10 | 12 | 12 | 14 | 15 |
| mph | 10 | 10 | 10 | 10 | 9 | 7 | 6 | 6 | 7 | 8 | 9 | 9 |
A monthly average windspeed of over 16km/h or 10mph suggests a location is fairly windy.
Relative humidity
The graph below shows the average relative humidity.
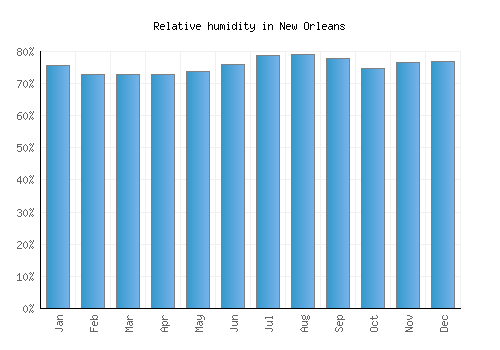
| Jan | Feb | Mar | Apr | May | Jun | Jul | Aug | Sep | Oct | Nov | Dec |
|---|---|---|---|---|---|---|---|---|---|---|---|
| 76% | 73% | 73% | 73% | 74% | 76% | 79% | 79% | 78% | 75% | 77% | 77% |

Other monthly averages
New Orleans weather stats
| Hottest month: | July | 32.5°C 90.5°F |
|---|---|---|
| Driest month: | October | 73mm 2.9ins |
| Sunniest month: | October | 8.4hrs |
| Coldest month: | January | 15.9°C 60.6°F |
| Wettest month: | July | 174mm 6.9ins |
| Warmest sea: | August | 29.8°C 85.6°F |

Locations nearby
Top United States locations
- Anaheim
- Anchorage
- Aspen
- Atlanta
- Boston
- Breckenridge
- Charleston
- Chicago
- Coney Island
- Dallas
- Death Valley
- Denver
- Destin
- Detroit
- Glacier National Park
- Grand Canyon
- Honolulu
- Houston
- Indianapolis
- Key West
- Lake Tahoe
- Las Vegas
- Los Angeles
- Malibu
- Manhattan
- Memphis
- Miami
- Minneapolis
- Myrtle Beach
- New Orleans
- New York City
- Niagara Falls
- Ocean City
- Orlando
- Palm Springs
- Philadelphia
- Phoenix
- Salt Lake City
- San Diego
- San Francisco
- Scottsdale
- Seattle
- Sedona
- Sonoma
- Washington, D. C.
- Yosemite National Park
- Zion National Park