San Diego (CA) monthly weather averages
What's the weather like in San Diego?
San Diego is a large coastal city located in the southwestern corner of California. The climate in San Diego is classified as an arid Mediterranean climate, with warm, dry summers but also mild, fairly dry winters. The average temperature in San Diego ranges from the mid-60s Farenheit (18 C) in the winter to the mid-70s (24 C) in the summer. The city also experiences low humidity, which helps to make the climate more comfortable.
Rainfall in San Diego is generally light, with most of the precipitation occurring in the winter months. The average annual rainfall is just over 10 inches (250mm), and most of the rain falls between November and March. The city also experiences a rare, occasional light snowfall during the winter months.
San Diego is well known for an abundance of sunshine throughout the year, with an average of about 260 sunny days per year. This makes San Diego an ideal place for outdoor activities, such as surfing and swimming. In addition, the city's mild climate makes it a popular vacation spot for people from around the world.
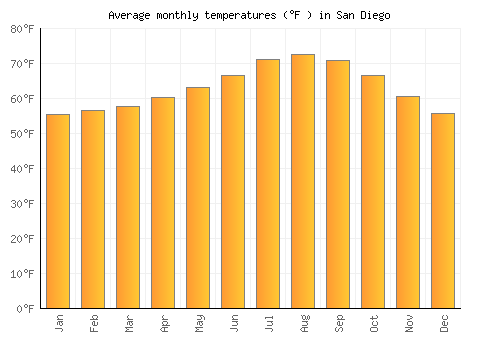
Average daytime temperature
The bar chart below shows the average monthly peak daytime temperatures at San Diego
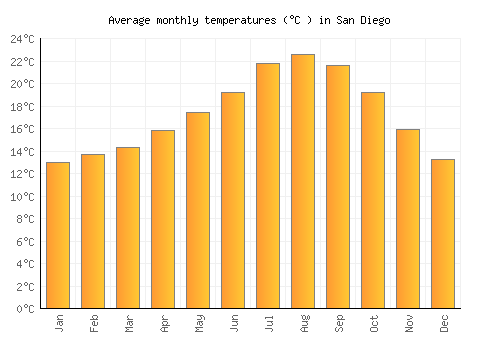
| Jan | Feb | Mar | Apr | May | Jun | Jul | Aug | Sep | Oct | Nov | Dec | |
|---|---|---|---|---|---|---|---|---|---|---|---|---|
| °C | 18.4 | 18.9 | 18.9 | 20.3 | 21.3 | 23.2 | 25.9 | 26.7 | 26 | 24.2 | 21.2 | 18.8 |
| °F | 65.1 | 66 | 66.1 | 68.6 | 70.3 | 73.7 | 78.7 | 80.1 | 78.9 | 75.5 | 70.2 | 65.9 |
Please note: these are the average peak daytime temperatures (usually around mid-afternoon) so do not show daytime / night highs and lows. To see the daily range of temperatures have a look at the temperature max / min chart below.
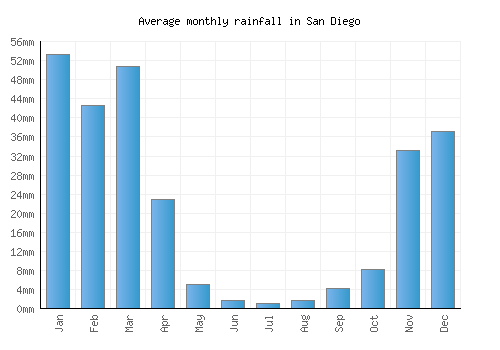
Average rainfall & rainy days
The graph below shows the average rainfall and number of rainy days per month.

| Jan | Feb | Mar | Apr | May | Jun | Jul | Aug | Sep | Oct | Nov | Dec | |
|---|---|---|---|---|---|---|---|---|---|---|---|---|
| mm | 53 | 43 | 51 | 23 | 5 | 2 | 1 | 2 | 4 | 8 | 33 | 37 |
| inches | 2.1 | 1.7 | 2 | 0.9 | 0.2 | 0.1 | 0 | 0.1 | 0.2 | 0.3 | 1.3 | 1.5 |
| Rainy days | 6 | 5 | 6 | 4 | 2 | 1 | 1 | 1 | 1 | 2 | 4 | 5 |
Average annual rainfall in San Diego: 177.267mm (69.8 inches)
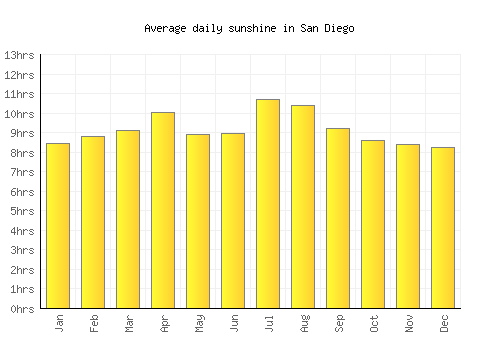
Average daily sunshine
The bar chart below shows the average daily sunshine hours in San Diego
| Jan | Feb | Mar | Apr | May | Jun | Jul | Aug | Sep | Oct | Nov | Dec | |
|---|---|---|---|---|---|---|---|---|---|---|---|---|
| Hrs sunshine | 8.5 | 8.8 | 9.1 | 10 | 8.9 | 9 | 10.7 | 10.4 | 9.2 | 8.6 | 8.4 | 8.2 |
Day / night temperatures
The graph below shows the daily range of temperatures for each month.
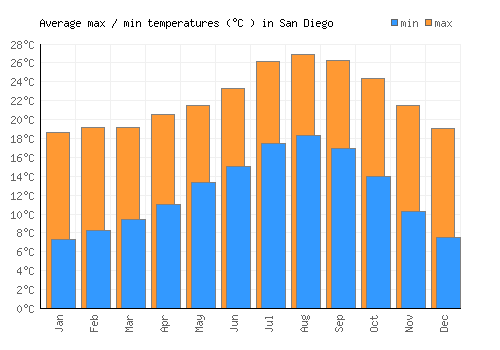
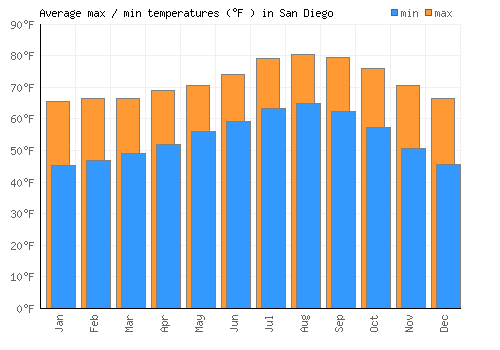
| Jan | Feb | Mar | Apr | May | Jun | Jul | Aug | Sep | Oct | Nov | Dec | |
|---|---|---|---|---|---|---|---|---|---|---|---|---|
| Min °C | 7.4 | 8.3 | 9.5 | 11.1 | 13.3 | 15.1 | 17.5 | 18.3 | 17 | 14 | 10.3 | 7.5 |
| Max °C | 18.7 | 19.2 | 19.2 | 20.6 | 21.5 | 23.4 | 26.2 | 26.9 | 26.3 | 24.4 | 21.5 | 19.1 |
| Min °F | 45.2 | 46.9 | 49 | 51.9 | 55.9 | 59.1 | 63.4 | 64.9 | 62.5 | 57.2 | 50.5 | 45.5 |
| Max °F | 55.4 | 56.7 | 57.7 | 60.4 | 63.3 | 66.6 | 71.2 | 72.7 | 70.9 | 66.6 | 60.6 | 55.9 |
Sea temperature
The graph below shows the average sea temperature.
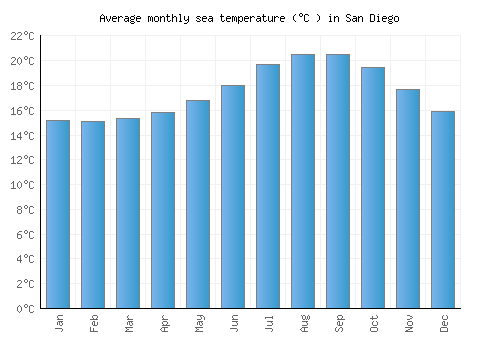
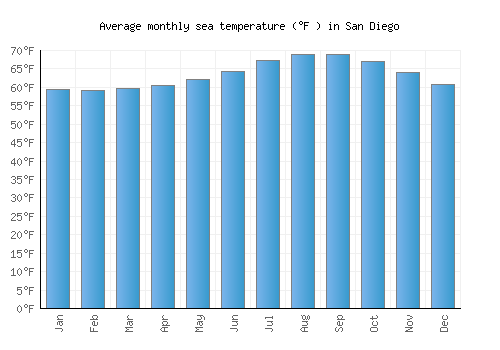
| Jan | Feb | Mar | Apr | May | Jun | Jul | Aug | Sep | Oct | Nov | Dec | |
|---|---|---|---|---|---|---|---|---|---|---|---|---|
| °C | 15.2 | 15.1 | 15.4 | 15.8 | 16.8 | 18 | 19.7 | 20.5 | 20.5 | 19.4 | 17.7 | 15.9 |
| °F | 59.3 | 59.2 | 59.6 | 60.5 | 62.2 | 64.4 | 67.4 | 68.9 | 68.9 | 67 | 63.9 | 60.7 |
Wind speed
The graph below shows the average wind speed.
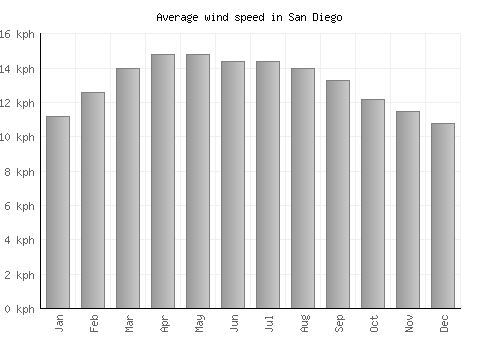
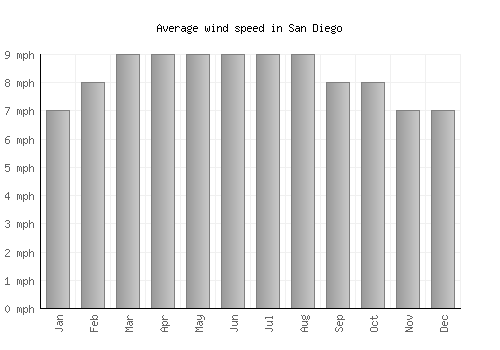
| Jan | Feb | Mar | Apr | May | Jun | Jul | Aug | Sep | Oct | Nov | Dec | |
|---|---|---|---|---|---|---|---|---|---|---|---|---|
| km/h | 11 | 13 | 14 | 15 | 15 | 14 | 14 | 14 | 13 | 12 | 12 | 11 |
| mph | 7 | 8 | 9 | 9 | 9 | 9 | 9 | 9 | 8 | 8 | 7 | 7 |
A monthly average windspeed of over 16km/h or 10mph suggests a location is fairly windy.
Relative humidity
The graph below shows the average relative humidity.
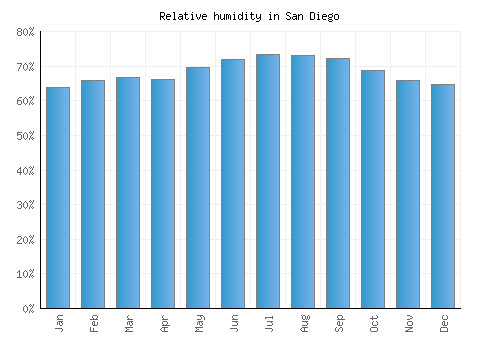
| Jan | Feb | Mar | Apr | May | Jun | Jul | Aug | Sep | Oct | Nov | Dec |
|---|---|---|---|---|---|---|---|---|---|---|---|
| 64% | 66% | 67% | 66% | 70% | 72% | 73% | 73% | 72% | 69% | 66% | 65% |

Other monthly averages
San Diego weather stats
| Hottest month: | August | 26.7°C 80.1°F |
|---|---|---|
| Driest month: | July | 1mm 0ins |
| Sunniest month: | January | 8.5hrs |
| Coldest month: | January | 18.4°C 65.1°F |
| Wettest month: | January | 53mm 2.1ins |
| Warmest sea: | September | 20.5°C 68.9°F |

Locations nearby
Top United States locations
- Anaheim
- Anchorage
- Aspen
- Atlanta
- Boston
- Breckenridge
- Charleston
- Chicago
- Coney Island
- Dallas
- Death Valley
- Denver
- Destin
- Detroit
- Glacier National Park
- Grand Canyon
- Honolulu
- Houston
- Indianapolis
- Key West
- Lake Tahoe
- Las Vegas
- Los Angeles
- Malibu
- Manhattan
- Memphis
- Miami
- Minneapolis
- Myrtle Beach
- New Orleans
- New York City
- Niagara Falls
- Ocean City
- Orlando
- Palm Springs
- Philadelphia
- Phoenix
- Salt Lake City
- San Diego
- San Francisco
- Scottsdale
- Seattle
- Sedona
- Sonoma
- Washington, D. C.
- Yosemite National Park
- Zion National Park