New York City (NY) monthly weather averages
What's the weather like in New York City?
Depending on who you ask New York City either has a humid subtropical climate or a humid continental climate - either way we can agree it has four distinct seasons. Summers are typically hot and humid, with average temperatures in the 80s (28°C) and high temperatures reaching the 90s (35°C) . Air pollution can be an issue in certain parts of the city but action has been taken to reduce air pollution, and the air quality has improved in recent years.
Winters in NYC are typically cold and wet, with average temperatures in the mid-30s (2°C) and lows reaching the teens. Snowfall is fairly common andt he city also experiences an average of two to three days of snowfall per year.
Spring and fall are mild and pleasant, with average temperatures in the 50s (12°C)and 60s (18°C) .
New York City gets an average of 44 inches (1,200mm) of precipitation each year, most of it falling in the form of rain. The city experiences relatively little extreme weather, but it can be subject to the occasional severe thunderstorms, the infamous Nor'easters and even hurricanes.
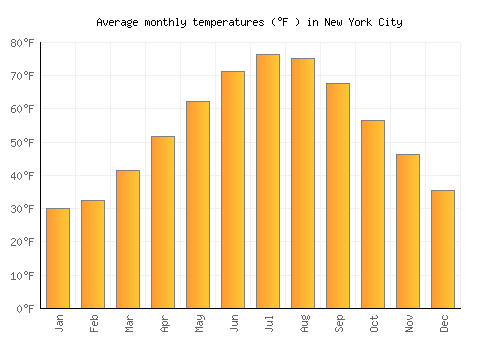
Average daytime temperature
The bar chart below shows the average monthly peak daytime temperatures at New York City
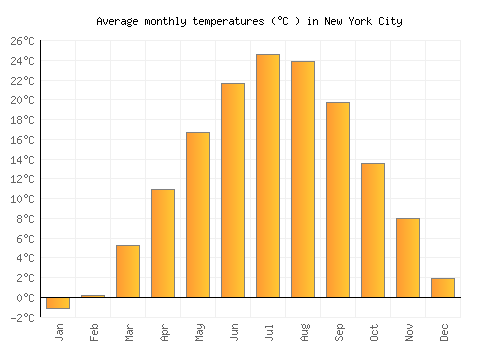
| Jan | Feb | Mar | Apr | May | Jun | Jul | Aug | Sep | Oct | Nov | Dec | |
|---|---|---|---|---|---|---|---|---|---|---|---|---|
| °C | 2.5 | 4.1 | 9.6 | 15.8 | 21.7 | 26.6 | 29.4 | 28.5 | 24.3 | 18.3 | 12 | 5.4 |
| °F | 36.5 | 39.3 | 49.3 | 60.4 | 71.1 | 79.9 | 84.9 | 83.3 | 75.7 | 64.9 | 53.5 | 41.7 |
Please note: these are the average peak daytime temperatures (usually around mid-afternoon) so do not show daytime / night highs and lows. To see the daily range of temperatures have a look at the temperature max / min chart below.
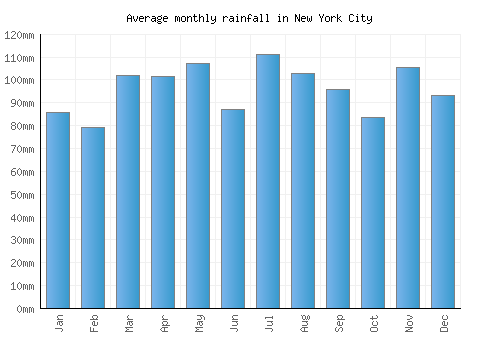
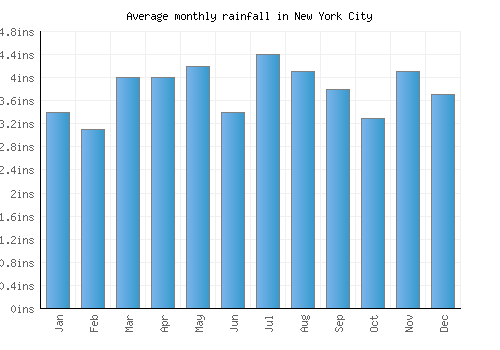
Average rainfall & rainy days
The graph below shows the average rainfall and number of rainy days per month.
| Jan | Feb | Mar | Apr | May | Jun | Jul | Aug | Sep | Oct | Nov | Dec | |
|---|---|---|---|---|---|---|---|---|---|---|---|---|
| mm | 86 | 79 | 102 | 102 | 107 | 87 | 111 | 103 | 96 | 84 | 105 | 93 |
| inches | 3.4 | 3.1 | 4 | 4 | 4.2 | 3.4 | 4.4 | 4.1 | 3.8 | 3.3 | 4.1 | 3.7 |
| Rainy days | 10 | 10 | 11 | 10 | 11 | 10 | 10 | 9 | 8 | 8 | 10 | 11 |
Average annual rainfall in New York City: 1121.167mm (441.4 inches)
Average daily sunshine
The bar chart below shows the average daily sunshine hours in New York City
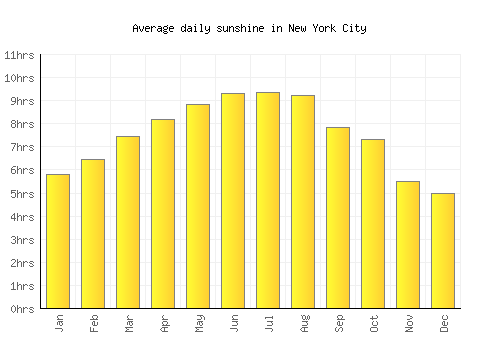
| Jan | Feb | Mar | Apr | May | Jun | Jul | Aug | Sep | Oct | Nov | Dec | |
|---|---|---|---|---|---|---|---|---|---|---|---|---|
| Hrs sunshine | 5.8 | 6.4 | 7.5 | 8.2 | 8.8 | 9.3 | 9.3 | 9.2 | 7.8 | 7.3 | 5.5 | 5 |
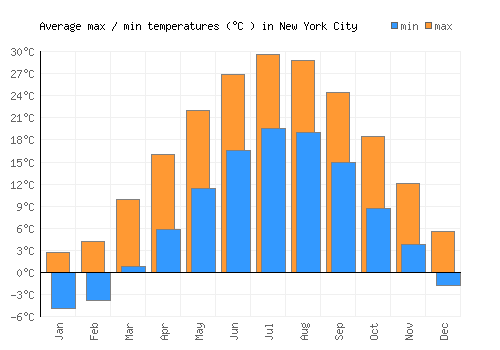
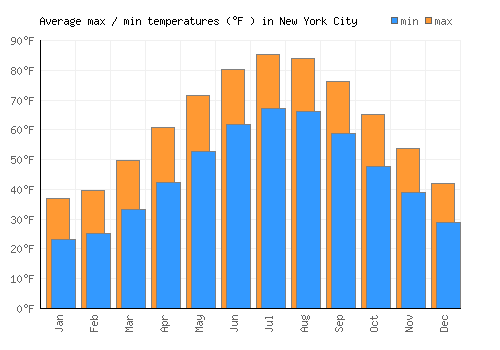
Day / night temperatures
The graph below shows the daily range of temperatures for each month.
| Jan | Feb | Mar | Apr | May | Jun | Jul | Aug | Sep | Oct | Nov | Dec | |
|---|---|---|---|---|---|---|---|---|---|---|---|---|
| Min °C | -4.9 | -3.9 | 0.8 | 5.8 | 11.5 | 16.6 | 19.6 | 19.1 | 14.9 | 8.7 | 3.9 | -1.8 |
| Max °C | 2.7 | 4.3 | 9.9 | 16 | 22 | 26.9 | 29.6 | 28.8 | 24.5 | 18.5 | 12.2 | 5.6 |
| Min °F | 23.2 | 25.1 | 33.4 | 42.4 | 52.6 | 61.8 | 67.3 | 66.3 | 58.8 | 47.7 | 38.9 | 28.9 |
| Max °F | 30 | 32.4 | 41.5 | 51.6 | 62.1 | 71.1 | 76.3 | 75 | 67.5 | 56.5 | 46.4 | 35.4 |
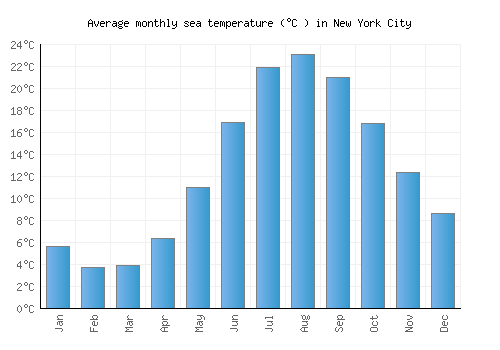
Sea temperature
The graph below shows the average sea temperature.
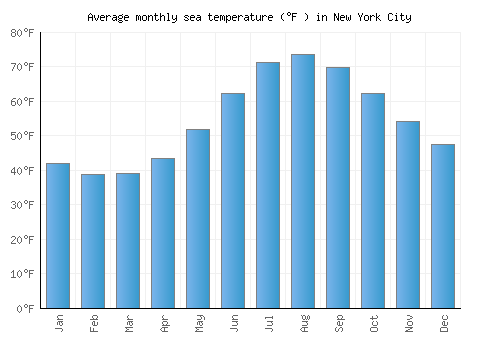
| Jan | Feb | Mar | Apr | May | Jun | Jul | Aug | Sep | Oct | Nov | Dec | |
|---|---|---|---|---|---|---|---|---|---|---|---|---|
| °C | 5.6 | 3.7 | 3.9 | 6.4 | 11 | 16.9 | 21.9 | 23.1 | 21 | 16.9 | 12.4 | 8.6 |
| °F | 42.1 | 38.7 | 39 | 43.5 | 51.8 | 62.4 | 71.4 | 73.6 | 69.8 | 62.4 | 54.3 | 47.5 |
Wind speed
The graph below shows the average wind speed.
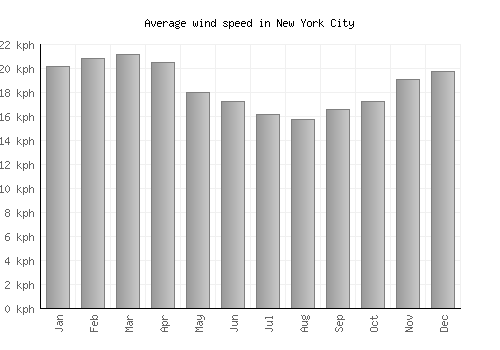
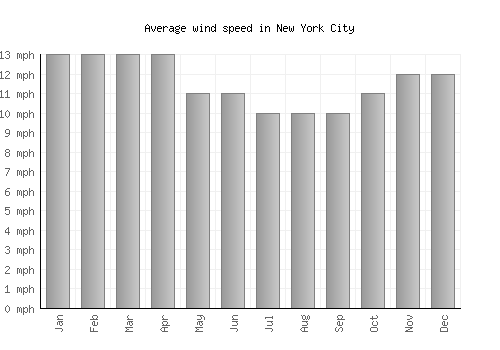
| Jan | Feb | Mar | Apr | May | Jun | Jul | Aug | Sep | Oct | Nov | Dec | |
|---|---|---|---|---|---|---|---|---|---|---|---|---|
| km/h | 20 | 21 | 21 | 21 | 18 | 17 | 16 | 16 | 17 | 17 | 19 | 20 |
| mph | 13 | 13 | 13 | 13 | 11 | 11 | 10 | 10 | 10 | 11 | 12 | 12 |
A monthly average windspeed of over 16km/h or 10mph suggests a location is fairly windy.
Relative humidity
The graph below shows the average relative humidity.
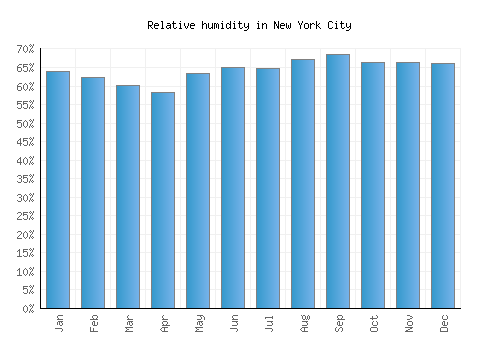
| Jan | Feb | Mar | Apr | May | Jun | Jul | Aug | Sep | Oct | Nov | Dec |
|---|---|---|---|---|---|---|---|---|---|---|---|
| 64% | 62% | 60% | 58% | 64% | 65% | 65% | 67% | 69% | 66% | 66% | 66% |

Other monthly averages
New York City weather stats
| Hottest month: | July | 29.4°C 84.9°F |
|---|---|---|
| Driest month: | February | 79mm 3.1ins |
| Sunniest month: | August | 9.2hrs |
| Coldest month: | January | 2.5°C 36.5°F |
| Wettest month: | July | 111mm 4.4ins |
| Warmest sea: | August | 23.1°C 73.6°F |

Locations nearby
Top United States locations
- Anaheim
- Anchorage
- Aspen
- Atlanta
- Boston
- Breckenridge
- Charleston
- Chicago
- Coney Island
- Dallas
- Death Valley
- Denver
- Destin
- Detroit
- Glacier National Park
- Grand Canyon
- Honolulu
- Houston
- Indianapolis
- Key West
- Lake Tahoe
- Las Vegas
- Los Angeles
- Malibu
- Manhattan
- Memphis
- Miami
- Minneapolis
- Myrtle Beach
- New Orleans
- New York City
- Niagara Falls
- Ocean City
- Orlando
- Palm Springs
- Philadelphia
- Phoenix
- Salt Lake City
- San Diego
- San Francisco
- Scottsdale
- Seattle
- Sedona
- Sonoma
- Washington, D. C.
- Yosemite National Park
- Zion National Park