Las Vegas (NV) monthly weather averages
What's the weather like in Las Vegas?
The climate of Las Vegas is classified as a hot desert climate, with hot dry summers and mild winters. The average high temperature in the summer is around 104°F (40°C), with temperatures occasionally reaching up to 115°F (46°C). The average high temperature in the winter is around 58°F (14°C), with lows around 37°F (3°C).
Average annual precipitation is 4.13 inches (105 mm), with most of it coming in the winter months. Snow can occur in the winter, but it is usually light and melts quickly. Las Vegas has an arid climate, which means that it has low humidity and generally clear skies.
The summer months can be quite hot and dry, with temperatures reaching up to 115°F (46°C). April through October are the months with the highest temperatures, with July and August being the hottest.
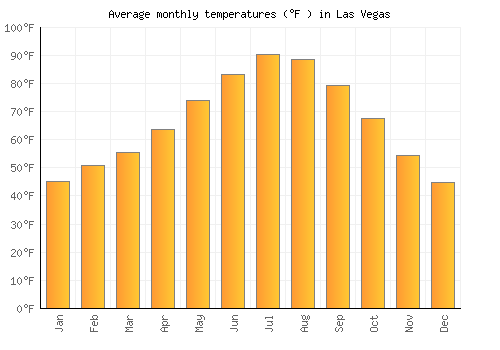
Average daytime temperature
The bar chart below shows the average monthly peak daytime temperatures at Las Vegas
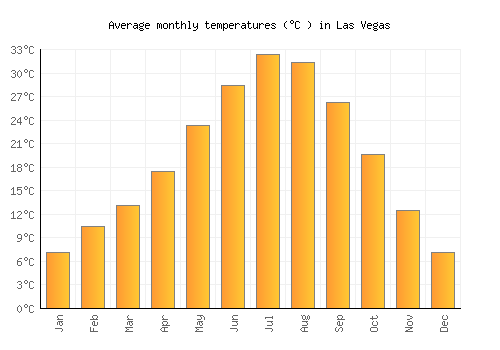
| Jan | Feb | Mar | Apr | May | Jun | Jul | Aug | Sep | Oct | Nov | Dec | |
|---|---|---|---|---|---|---|---|---|---|---|---|---|
| °C | 13.5 | 16.7 | 19.7 | 24.4 | 30.5 | 36.1 | 39.8 | 38.5 | 33.8 | 27.1 | 19 | 13.2 |
| °F | 56.4 | 62.1 | 67.4 | 75.9 | 86.9 | 97 | 103.7 | 101.4 | 92.8 | 80.8 | 66.2 | 55.8 |
Please note: these are the average peak daytime temperatures (usually around mid-afternoon) so do not show daytime / night highs and lows. To see the daily range of temperatures have a look at the temperature max / min chart below.
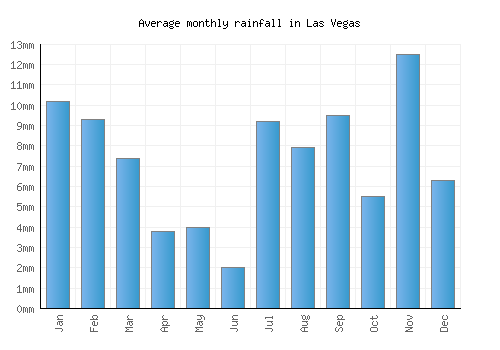
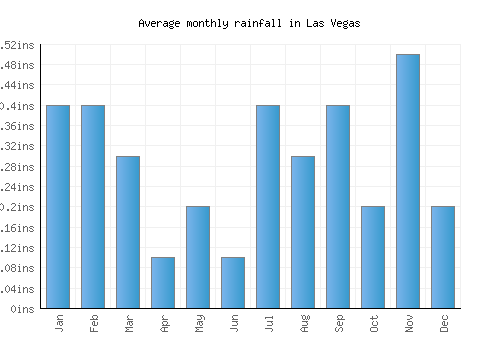
Average rainfall & rainy days
The graph below shows the average rainfall and number of rainy days per month.
| Jan | Feb | Mar | Apr | May | Jun | Jul | Aug | Sep | Oct | Nov | Dec | |
|---|---|---|---|---|---|---|---|---|---|---|---|---|
| mm | 10 | 9 | 7 | 4 | 4 | 2 | 9 | 8 | 10 | 6 | 13 | 6 |
| inches | 0.4 | 0.4 | 0.3 | 0.1 | 0.2 | 0.1 | 0.4 | 0.3 | 0.4 | 0.2 | 0.5 | 0.2 |
| Rainy days | 3 | 3 | 3 | 2 | 2 | 1 | 2 | 3 | 2 | 2 | 2 | 3 |
Average annual rainfall in Las Vegas: 8.767mm (3.5 inches)
Average daily sunshine
The bar chart below shows the average daily sunshine hours in Las Vegas
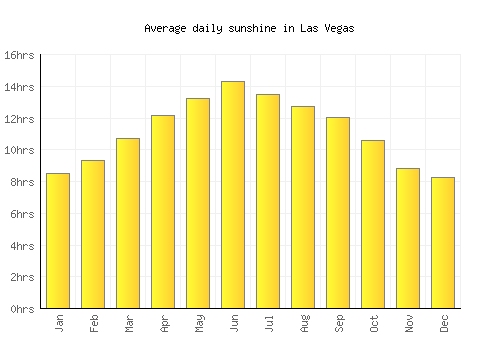
| Jan | Feb | Mar | Apr | May | Jun | Jul | Aug | Sep | Oct | Nov | Dec | |
|---|---|---|---|---|---|---|---|---|---|---|---|---|
| Hrs sunshine | 8.5 | 9.4 | 10.7 | 12.2 | 13.2 | 14.3 | 13.5 | 12.7 | 12 | 10.6 | 8.8 | 8.3 |
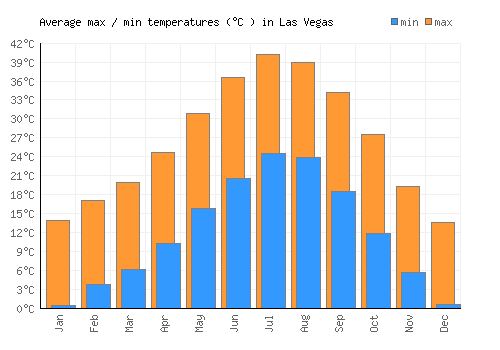
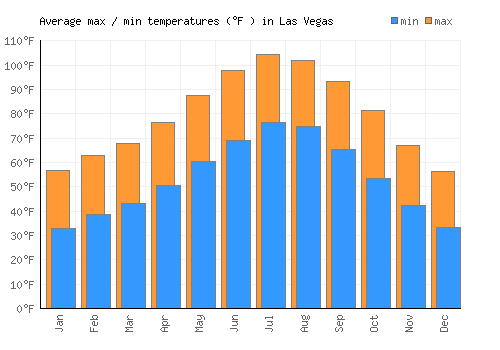
Day / night temperatures
The graph below shows the daily range of temperatures for each month.
| Jan | Feb | Mar | Apr | May | Jun | Jul | Aug | Sep | Oct | Nov | Dec | |
|---|---|---|---|---|---|---|---|---|---|---|---|---|
| Min °C | 0.6 | 3.8 | 6.2 | 10.3 | 15.8 | 20.5 | 24.6 | 23.9 | 18.5 | 11.9 | 5.7 | 0.7 |
| Max °C | 13.9 | 17.1 | 20 | 24.8 | 30.9 | 36.5 | 40.2 | 38.9 | 34.2 | 27.5 | 19.4 | 13.6 |
| Min °F | 33 | 38.8 | 43.2 | 50.5 | 60.4 | 68.9 | 76.3 | 75 | 65.2 | 53.4 | 42.2 | 33.2 |
| Max °F | 45 | 50.7 | 55.6 | 63.5 | 73.9 | 83.3 | 90.3 | 88.5 | 79.3 | 67.5 | 54.5 | 44.8 |
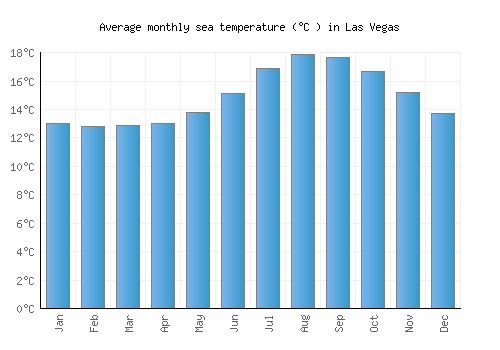
Sea temperature
The graph below shows the average sea temperature.
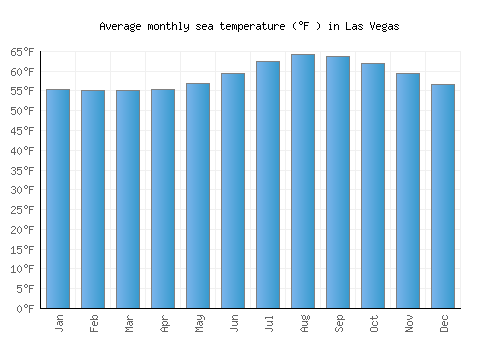
| Jan | Feb | Mar | Apr | May | Jun | Jul | Aug | Sep | Oct | Nov | Dec | |
|---|---|---|---|---|---|---|---|---|---|---|---|---|
| °C | 13 | 12.8 | 12.9 | 13 | 13.8 | 15.1 | 16.9 | 17.9 | 17.7 | 16.6 | 15.2 | 13.7 |
| °F | 55.4 | 55.1 | 55.2 | 55.4 | 56.9 | 59.3 | 62.4 | 64.2 | 63.8 | 62 | 59.3 | 56.7 |
Wind speed
The graph below shows the average wind speed.
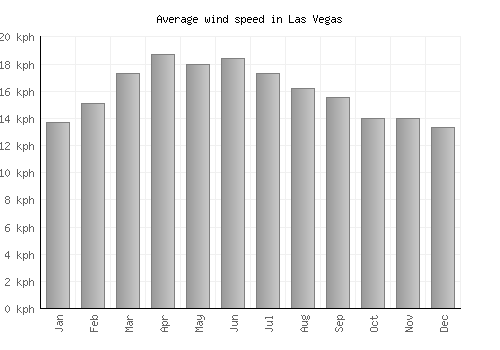
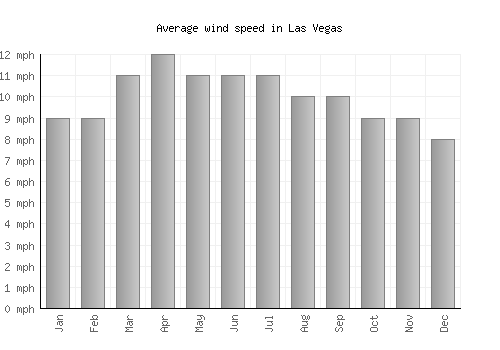
| Jan | Feb | Mar | Apr | May | Jun | Jul | Aug | Sep | Oct | Nov | Dec | |
|---|---|---|---|---|---|---|---|---|---|---|---|---|
| km/h | 14 | 15 | 17 | 19 | 18 | 18 | 17 | 16 | 16 | 14 | 14 | 13 |
| mph | 9 | 9 | 11 | 12 | 11 | 11 | 11 | 10 | 10 | 9 | 9 | 8 |
A monthly average windspeed of over 16km/h or 10mph suggests a location is fairly windy.
Relative humidity
The graph below shows the average relative humidity.
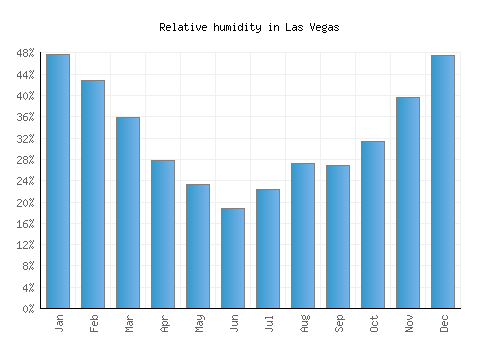
| Jan | Feb | Mar | Apr | May | Jun | Jul | Aug | Sep | Oct | Nov | Dec |
|---|---|---|---|---|---|---|---|---|---|---|---|
| 48% | 43% | 36% | 28% | 23% | 19% | 22% | 27% | 27% | 31% | 40% | 48% |

Other monthly averages
Las Vegas weather stats
| Hottest month: | July | 39.8°C 103.6°F |
|---|---|---|
| Driest month: | June | 2mm 0.1ins |
| Sunniest month: | June | 14.3hrs |
| Coldest month: | December | 13.2°C 55.8°F |
| Wettest month: | November | 13mm 0.5ins |
| Warmest sea: | August | 17.9°C 64.2°F |

Top United States locations
- Anaheim
- Anchorage
- Aspen
- Atlanta
- Boston
- Breckenridge
- Charleston
- Chicago
- Coney Island
- Dallas
- Death Valley
- Denver
- Destin
- Detroit
- Glacier National Park
- Grand Canyon
- Honolulu
- Houston
- Indianapolis
- Key West
- Lake Tahoe
- Las Vegas
- Los Angeles
- Malibu
- Manhattan
- Memphis
- Miami
- Minneapolis
- Myrtle Beach
- New Orleans
- New York City
- Niagara Falls
- Ocean City
- Orlando
- Palm Springs
- Philadelphia
- Phoenix
- Salt Lake City
- San Diego
- San Francisco
- Scottsdale
- Seattle
- Sedona
- Sonoma
- Washington, D. C.
- Yosemite National Park
- Zion National Park