San Francisco (CA) monthly weather averages
What's the weather like in San Francisco?
San Francisco has a mild, 'Mediterranean' climate with cool, rainy winters and dry, warm summers. The city has a respectable average of 263 sunny days a year and temperatures typically range from 40 to 70 degrees Fahrenheit (4 to 21 degrees Celsius). The city has low levels of precipitation, receiving an average of 23 inches (58.4 cm) of rain annually. Snow is rare in San Francisco, but it does occur occasionally in the higher elevations of the city.
San Francisco is a coastal city, so it experiences strong winds and fog throughout the year. Located in an area known as the 'fog belt', this means the city experiences foggy conditions more often than other parts of the state. The fog is most common during the summer months, although it can occur at any time of year. This fog is a result of the combination of the city's location by the ocean and its hilly topography.
Climate change is having a significant impact on San Francisco. As temperatures rise and snowfall decreases, the city is experiencing more extreme weather events, such as heat waves and droughts. In addition, rising sea levels are threatening the city's coastline, leading to increased flooding and erosion.
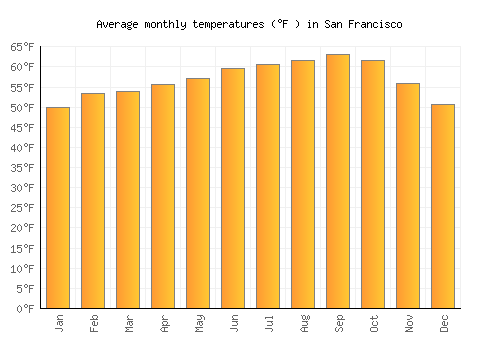
Average daytime temperature
The bar chart below shows the average monthly peak daytime temperatures at San Francisco
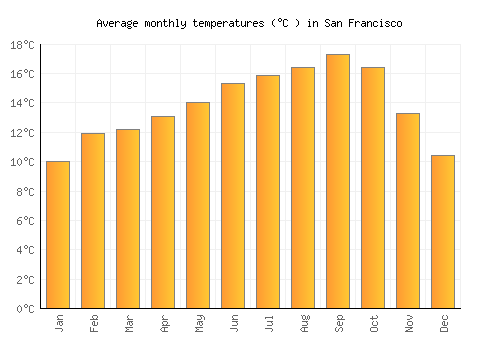
| Jan | Feb | Mar | Apr | May | Jun | Jul | Aug | Sep | Oct | Nov | Dec | |
|---|---|---|---|---|---|---|---|---|---|---|---|---|
| °C | 13.2 | 15.3 | 15.8 | 16.9 | 17.9 | 19.2 | 19.8 | 20.1 | 21.4 | 20.6 | 16.8 | 13.5 |
| °F | 55.8 | 59.6 | 60.4 | 62.4 | 64.1 | 66.5 | 67.6 | 68.2 | 70.5 | 69.1 | 62.2 | 56.3 |
Please note: these are the average peak daytime temperatures (usually around mid-afternoon) so do not show daytime / night highs and lows. To see the daily range of temperatures have a look at the temperature max / min chart below.
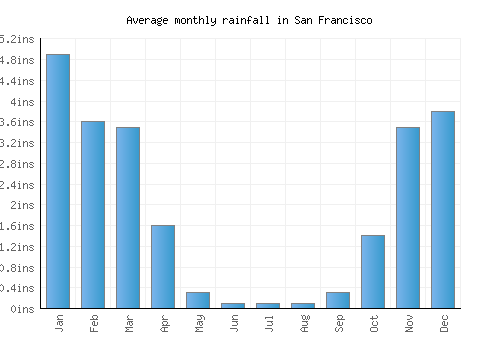
Average rainfall & rainy days
The graph below shows the average rainfall and number of rainy days per month.

| Jan | Feb | Mar | Apr | May | Jun | Jul | Aug | Sep | Oct | Nov | Dec | |
|---|---|---|---|---|---|---|---|---|---|---|---|---|
| mm | 125 | 91 | 89 | 40 | 7 | 4 | 1 | 2 | 7 | 35 | 90 | 97 |
| inches | 4.9 | 3.6 | 3.5 | 1.6 | 0.3 | 0.1 | 0.1 | 0.1 | 0.3 | 1.4 | 3.5 | 3.8 |
| Rainy days | 10 | 9 | 11 | 6 | 3 | 1 | 1 | 1 | 2 | 4 | 8 | 10 |
Average annual rainfall in San Francisco: 502.233mm (197.7 inches)
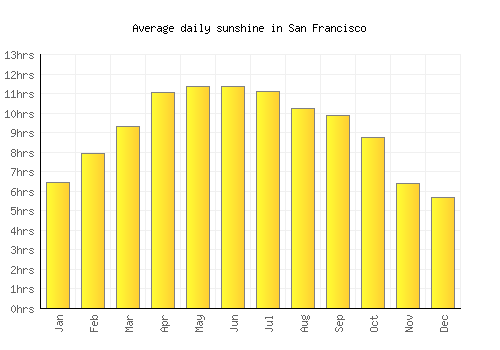
Average daily sunshine
The bar chart below shows the average daily sunshine hours in San Francisco
| Jan | Feb | Mar | Apr | May | Jun | Jul | Aug | Sep | Oct | Nov | Dec | |
|---|---|---|---|---|---|---|---|---|---|---|---|---|
| Hrs sunshine | 6.4 | 7.9 | 9.3 | 11 | 11.4 | 11.4 | 11.1 | 10.2 | 9.9 | 8.7 | 6.4 | 5.7 |
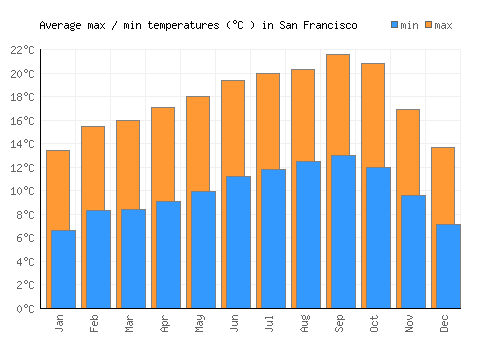
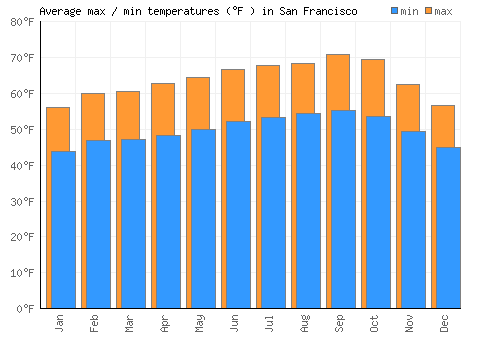
Day / night temperatures
The graph below shows the daily range of temperatures for each month.
| Jan | Feb | Mar | Apr | May | Jun | Jul | Aug | Sep | Oct | Nov | Dec | |
|---|---|---|---|---|---|---|---|---|---|---|---|---|
| Min °C | 6.6 | 8.3 | 8.5 | 9.1 | 10 | 11.3 | 11.9 | 12.5 | 13 | 12 | 9.7 | 7.2 |
| Max °C | 13.4 | 15.5 | 16 | 17.1 | 18.1 | 19.4 | 20 | 20.3 | 21.6 | 20.8 | 17 | 13.7 |
| Min °F | 43.9 | 46.9 | 47.2 | 48.4 | 49.9 | 52.3 | 53.3 | 54.5 | 55.4 | 53.6 | 49.4 | 44.9 |
| Max °F | 50 | 53.4 | 54 | 55.6 | 57.2 | 59.5 | 60.6 | 61.5 | 63.1 | 61.5 | 55.9 | 50.7 |
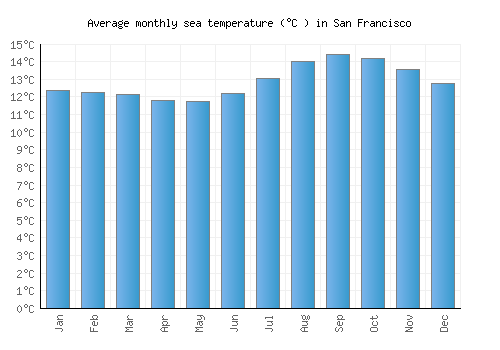
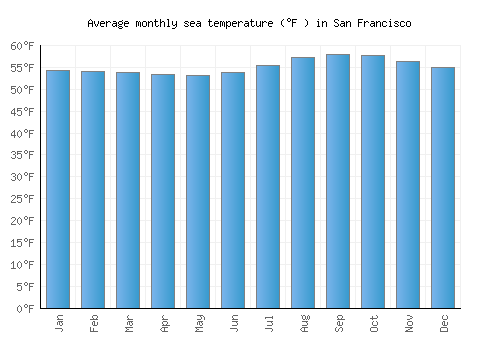
Sea temperature
The graph below shows the average sea temperature.
| Jan | Feb | Mar | Apr | May | Jun | Jul | Aug | Sep | Oct | Nov | Dec | |
|---|---|---|---|---|---|---|---|---|---|---|---|---|
| °C | 12.4 | 12.2 | 12.2 | 11.8 | 11.8 | 12.2 | 13.1 | 14 | 14.4 | 14.2 | 13.6 | 12.7 |
| °F | 54.2 | 54 | 53.9 | 53.3 | 53.2 | 53.9 | 55.5 | 57.2 | 57.9 | 57.6 | 56.4 | 54.9 |
Wind speed
The graph below shows the average wind speed.
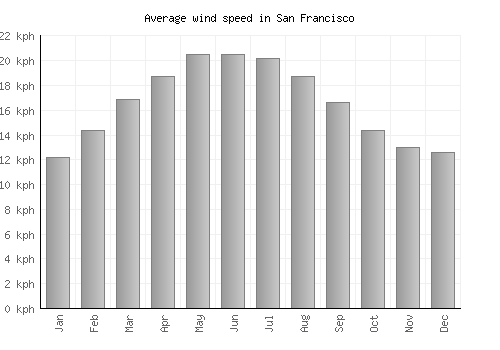
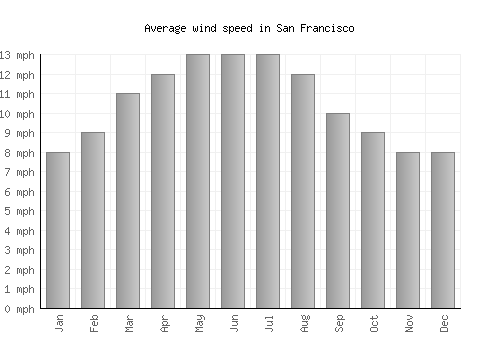
| Jan | Feb | Mar | Apr | May | Jun | Jul | Aug | Sep | Oct | Nov | Dec | |
|---|---|---|---|---|---|---|---|---|---|---|---|---|
| km/h | 12 | 14 | 17 | 19 | 21 | 21 | 20 | 19 | 17 | 14 | 13 | 13 |
| mph | 8 | 9 | 11 | 12 | 13 | 13 | 13 | 12 | 10 | 9 | 8 | 8 |
A monthly average windspeed of over 16km/h or 10mph suggests a location is fairly windy.
Relative humidity
The graph below shows the average relative humidity.
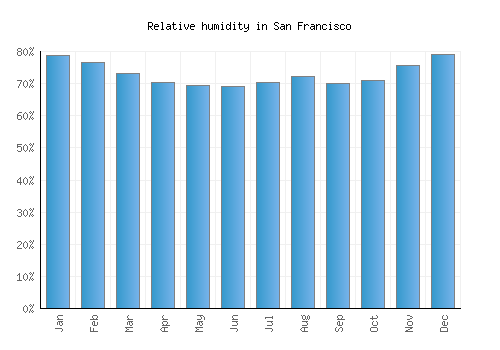
| Jan | Feb | Mar | Apr | May | Jun | Jul | Aug | Sep | Oct | Nov | Dec |
|---|---|---|---|---|---|---|---|---|---|---|---|
| 79% | 77% | 73% | 70% | 70% | 69% | 70% | 72% | 70% | 71% | 76% | 79% |
Other monthly averages
San Francisco weather stats
| Hottest month: | September | 21.4°C 70.5°F |
|---|---|---|
| Driest month: | July | 1mm 0ins |
| Sunniest month: | April | 11hrs |
| Coldest month: | January | 13.2°C 55.8°F |
| Wettest month: | January | 125mm 4.9ins |
| Warmest sea: | September | 14.4°C 57.9°F |

Locations nearby
Top United States locations
- Anaheim
- Anchorage
- Aspen
- Atlanta
- Boston
- Breckenridge
- Charleston
- Chicago
- Coney Island
- Dallas
- Death Valley
- Denver
- Destin
- Detroit
- Glacier National Park
- Grand Canyon
- Honolulu
- Houston
- Indianapolis
- Key West
- Lake Tahoe
- Las Vegas
- Los Angeles
- Malibu
- Manhattan
- Memphis
- Miami
- Minneapolis
- Myrtle Beach
- New Orleans
- New York City
- Niagara Falls
- Ocean City
- Orlando
- Palm Springs
- Philadelphia
- Phoenix
- Salt Lake City
- San Diego
- San Francisco
- Scottsdale
- Seattle
- Sedona
- Sonoma
- Washington, D. C.
- Yosemite National Park
- Zion National Park