Miami (FL) monthly weather averages
What's the weather like in Miami?
Miami has a tropical monsoon climate, with hot and humid summers along with shorter, warm winter whuch are markedly drier. This Florida city's sea-level elevation, coastal location, position just above the Tropic of Cancer, and proximity to the Gulf Stream all shape its climate.
Average monthly temperatures range from highs in the upper 80s°F (30°C) to lows in the mid 70s°F (23°C). The hottest month is July, with an average high of 89° Fahrenheit (32° Celsius) while the coldest month is January, with an average high of 76° Fahrenheit (25° Celsius).
Miami receives an average of 59 inches (1500 millimeters) of rain per year. The wettest month is October, with an average of 8 inches (200 millimeters) of rain. The driest month is February, with an average of 2.3 inches (60 millimeters) of rain.
Miami is also prone to the occasional tropical storm and hurricane due to its proximity to the Atlantic Ocean. Hurricanes making landfall in Miami can cause widespread damage and power outages throughout the city.
With great beaches and its tropical climate, Miami is a popular tourist destination. The city also offers a variety of attractions, including beaches, museums, and nightlife.
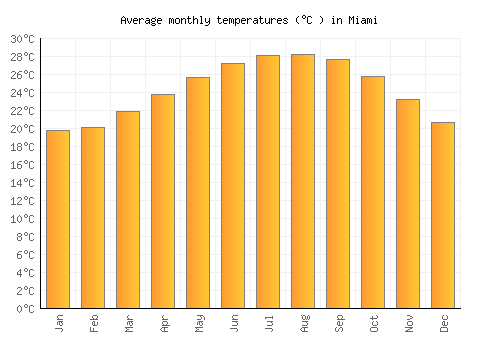
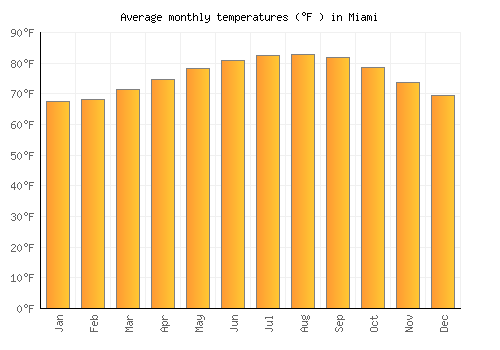
Average daytime temperature
The bar chart below shows the average monthly peak daytime temperatures at Miami
| Jan | Feb | Mar | Apr | May | Jun | Jul | Aug | Sep | Oct | Nov | Dec | |
|---|---|---|---|---|---|---|---|---|---|---|---|---|
| °C | 23.5 | 23.9 | 25.2 | 27 | 28.7 | 30.1 | 31.1 | 31.1 | 30.5 | 28.7 | 26.3 | 24.2 |
| °F | 74.2 | 75 | 77.4 | 80.7 | 83.6 | 86.2 | 87.9 | 88 | 86.9 | 83.6 | 79.3 | 75.5 |
Please note: these are the average peak daytime temperatures (usually around mid-afternoon) so do not show daytime / night highs and lows. To see the daily range of temperatures have a look at the temperature max / min chart below.
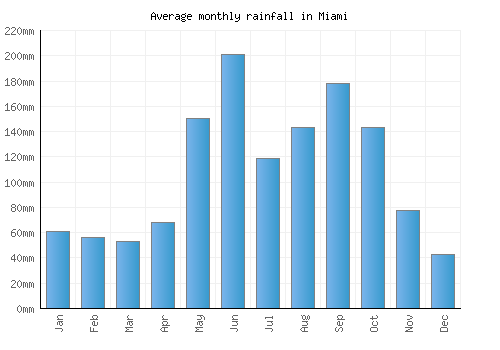
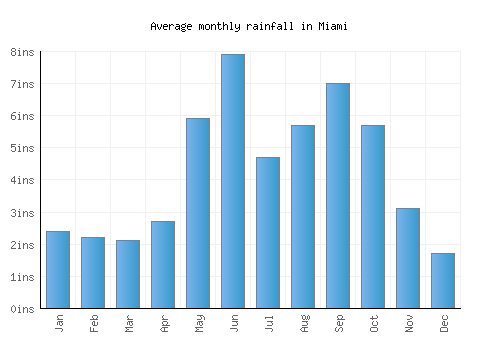
Average rainfall & rainy days
The graph below shows the average rainfall and number of rainy days per month.
| Jan | Feb | Mar | Apr | May | Jun | Jul | Aug | Sep | Oct | Nov | Dec | |
|---|---|---|---|---|---|---|---|---|---|---|---|---|
| mm | 61 | 56 | 53 | 68 | 150 | 201 | 119 | 144 | 178 | 144 | 78 | 43 |
| inches | 2.4 | 2.2 | 2.1 | 2.7 | 5.9 | 7.9 | 4.7 | 5.7 | 7 | 5.7 | 3.1 | 1.7 |
| Rainy days | 7 | 6 | 6 | 5 | 11 | 16 | 16 | 18 | 17 | 14 | 9 | 6 |
Average annual rainfall in Miami: 1239.2mm (487.9 inches)
Average daily sunshine
The bar chart below shows the average daily sunshine hours in Miami
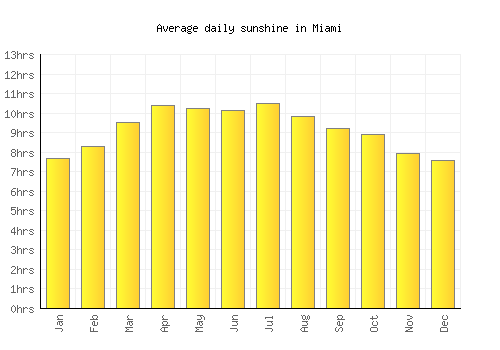
| Jan | Feb | Mar | Apr | May | Jun | Jul | Aug | Sep | Oct | Nov | Dec | |
|---|---|---|---|---|---|---|---|---|---|---|---|---|
| Hrs sunshine | 7.7 | 8.3 | 9.5 | 10.4 | 10.3 | 10.1 | 10.5 | 9.8 | 9.2 | 8.9 | 7.9 | 7.6 |
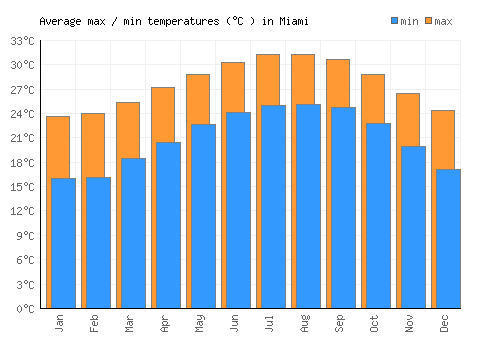
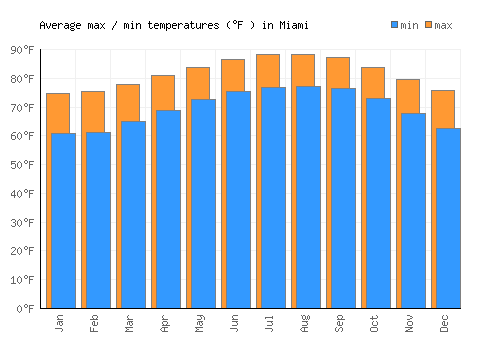
Day / night temperatures
The graph below shows the daily range of temperatures for each month.
| Jan | Feb | Mar | Apr | May | Jun | Jul | Aug | Sep | Oct | Nov | Dec | |
|---|---|---|---|---|---|---|---|---|---|---|---|---|
| Min °C | 16 | 16.2 | 18.4 | 20.4 | 22.6 | 24.2 | 25 | 25.2 | 24.8 | 22.8 | 20 | 17.1 |
| Max °C | 23.7 | 24.1 | 25.4 | 27.2 | 28.8 | 30.3 | 31.2 | 31.3 | 30.7 | 28.8 | 26.5 | 24.4 |
| Min °F | 60.7 | 61.1 | 65.1 | 68.7 | 72.7 | 75.5 | 77 | 77.3 | 76.6 | 73 | 67.9 | 62.7 |
| Max °F | 67.6 | 68.2 | 71.4 | 74.8 | 78.3 | 81 | 82.6 | 82.8 | 81.9 | 78.4 | 73.8 | 69.3 |
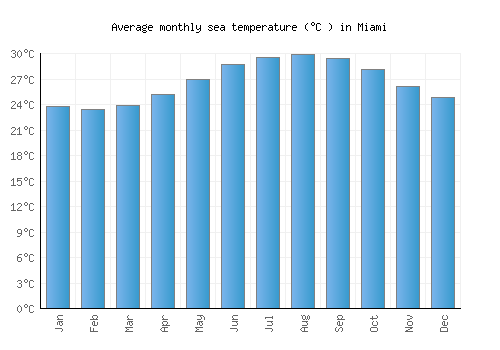
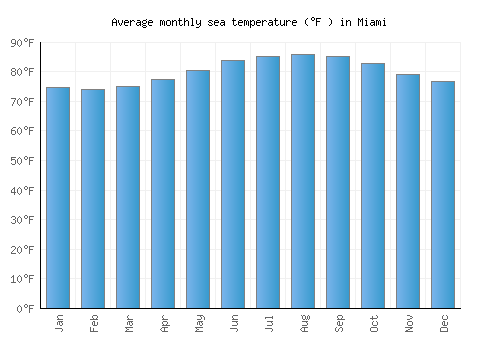
Sea temperature
The graph below shows the average sea temperature.
| Jan | Feb | Mar | Apr | May | Jun | Jul | Aug | Sep | Oct | Nov | Dec | |
|---|---|---|---|---|---|---|---|---|---|---|---|---|
| °C | 23.7 | 23.4 | 23.9 | 25.1 | 26.9 | 28.7 | 29.6 | 29.9 | 29.4 | 28.1 | 26.2 | 24.8 |
| °F | 74.7 | 74.1 | 75 | 77.3 | 80.4 | 83.7 | 85.2 | 85.8 | 85 | 82.6 | 79.1 | 76.7 |
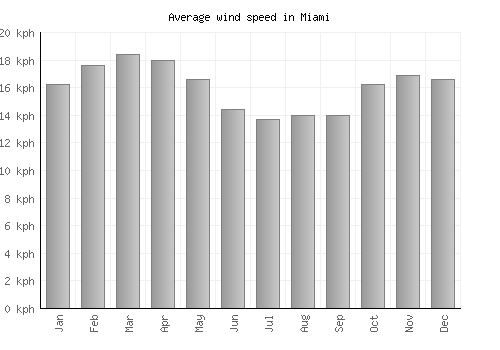
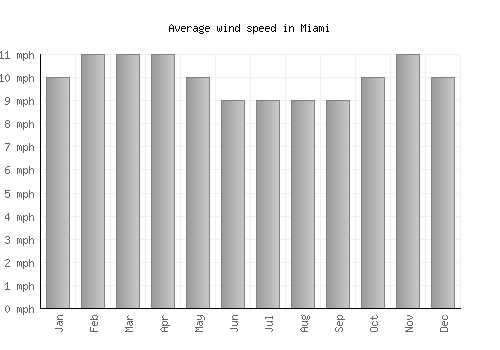
Wind speed
The graph below shows the average wind speed.
| Jan | Feb | Mar | Apr | May | Jun | Jul | Aug | Sep | Oct | Nov | Dec | |
|---|---|---|---|---|---|---|---|---|---|---|---|---|
| km/h | 16 | 18 | 18 | 18 | 17 | 14 | 14 | 14 | 14 | 16 | 17 | 17 |
| mph | 10 | 11 | 11 | 11 | 10 | 9 | 9 | 9 | 9 | 10 | 11 | 10 |
A monthly average windspeed of over 16km/h or 10mph suggests a location is fairly windy.
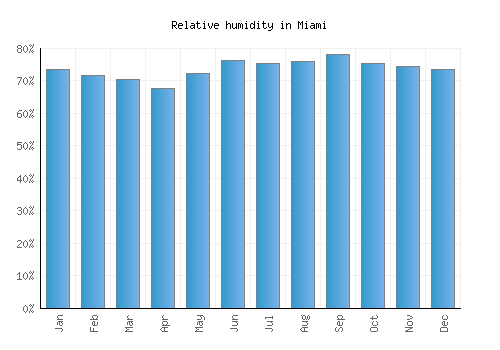
Relative humidity
The graph below shows the average relative humidity.
| Jan | Feb | Mar | Apr | May | Jun | Jul | Aug | Sep | Oct | Nov | Dec |
|---|---|---|---|---|---|---|---|---|---|---|---|
| 74% | 72% | 71% | 68% | 72% | 76% | 75% | 76% | 78% | 75% | 74% | 74% |

Other monthly averages
Miami weather stats
| Hottest month: | August | 31.1°C 88°F |
|---|---|---|
| Driest month: | December | 43mm 1.7ins |
| Sunniest month: | April | 10.4hrs |
| Coldest month: | January | 23.5°C 74.3°F |
| Wettest month: | June | 201mm 7.9ins |
| Warmest sea: | August | 29.9°C 85.8°F |

Locations nearby
Top United States locations
- Anaheim
- Anchorage
- Aspen
- Atlanta
- Boston
- Breckenridge
- Charleston
- Chicago
- Coney Island
- Dallas
- Death Valley
- Denver
- Destin
- Detroit
- Glacier National Park
- Grand Canyon
- Honolulu
- Houston
- Indianapolis
- Key West
- Lake Tahoe
- Las Vegas
- Los Angeles
- Malibu
- Manhattan
- Memphis
- Miami
- Minneapolis
- Myrtle Beach
- New Orleans
- New York City
- Niagara Falls
- Ocean City
- Orlando
- Palm Springs
- Philadelphia
- Phoenix
- Salt Lake City
- San Diego
- San Francisco
- Scottsdale
- Seattle
- Sedona
- Sonoma
- Washington, D. C.
- Yosemite National Park
- Zion National Park