Los Angeles (CA) monthly weather averages
What's the weather like in Los Angeles?
Los Angeles, California has a mild Mediterranean climate which is charaterized by warm, dry summers and cool, relatively wet winters. The climate is influenced by both the city's proximity to the ocean and the hills and mountains that surround it. This complex topography also creates any number of microclimates within the LA sprawl.
Summers in the Los Angeles area are generally quite hot and dry, with temperatures often hitting the 90s Fahrenheit (32-37°C). During the summer months, humidity is generally low, but temperatures can still get uncomfortably high.
Winters in L.A. are usually mild and wet, with temperatures rarely dropping below freezing. Rainfall during the winter months is usually light, but can be heavy at times. During the winter, temperatures can sometimes drop into the 40s Fahrenheit (4-9°C), but snow is extremely rare in the city.
Los Angeles often experiences periods of drought, which can cause water shortages and even lead to water rationing. The city also experiences air pollution due to the high number of cars and industry in the region which can cause health problems for people living in the area.
Average daytime temperature
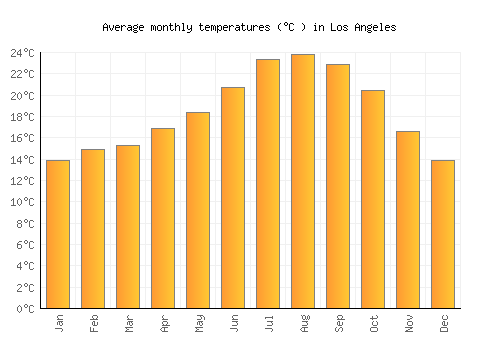
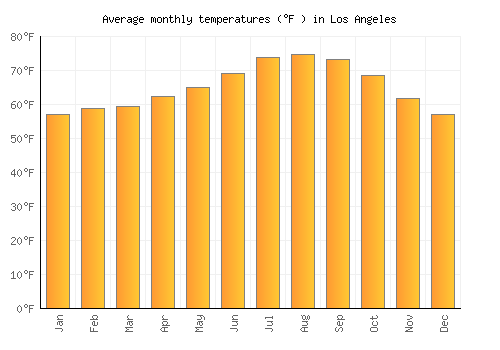
The bar chart below shows the average monthly peak daytime temperatures at Los Angeles
| Jan | Feb | Mar | Apr | May | Jun | Jul | Aug | Sep | Oct | Nov | Dec | |
|---|---|---|---|---|---|---|---|---|---|---|---|---|
| °C | 19.3 | 20.3 | 20.4 | 22.1 | 23.2 | 25.7 | 28.9 | 29.3 | 28.3 | 25.9 | 22.1 | 19.3 |
| °F | 66.7 | 68.5 | 68.7 | 71.8 | 73.8 | 78.3 | 84.1 | 84.8 | 82.9 | 78.7 | 71.7 | 66.8 |
Please note: these are the average peak daytime temperatures (usually around mid-afternoon) so do not show daytime / night highs and lows. To see the daily range of temperatures have a look at the temperature max / min chart below.
Average rainfall & rainy days
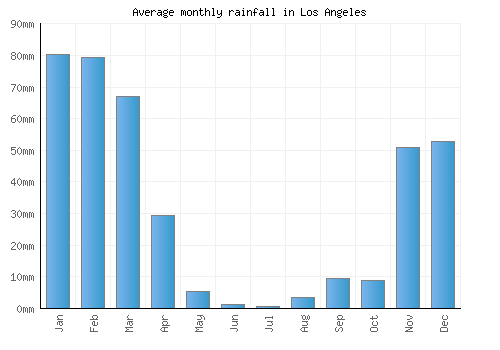
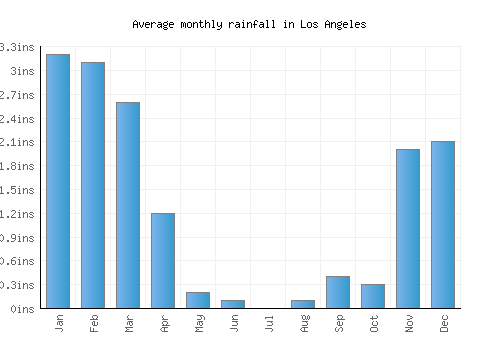
The graph below shows the average rainfall and number of rainy days per month.
| Jan | Feb | Mar | Apr | May | Jun | Jul | Aug | Sep | Oct | Nov | Dec | |
|---|---|---|---|---|---|---|---|---|---|---|---|---|
| mm | 80 | 79 | 67 | 29 | 5 | 1 | 1 | 4 | 9 | 9 | 51 | 53 |
| inches | 3.2 | 3.1 | 2.6 | 1.2 | 0.2 | 0.1 | 0 | 0.1 | 0.4 | 0.3 | 2 | 2.1 |
| Rainy days | 5 | 5 | 6 | 3 | 1 | 0 | 0 | 1 | 2 | 2 | 4 | 5 |
Average annual rainfall in Los Angeles: 304.533mm (119.9 inches)
Average daily sunshine
The bar chart below shows the average daily sunshine hours in Los Angeles
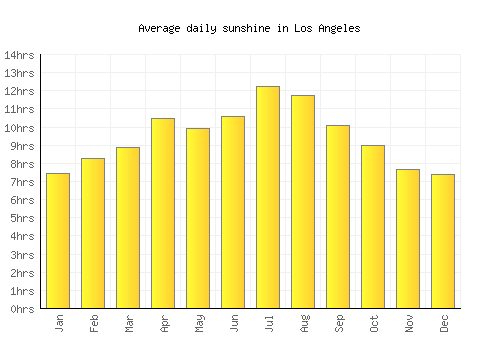
| Jan | Feb | Mar | Apr | May | Jun | Jul | Aug | Sep | Oct | Nov | Dec | |
|---|---|---|---|---|---|---|---|---|---|---|---|---|
| Hrs sunshine | 7.5 | 8.3 | 8.9 | 10.5 | 9.9 | 10.6 | 12.2 | 11.7 | 10.1 | 9 | 7.6 | 7.4 |
Day / night temperatures
The graph below shows the daily range of temperatures for each month.
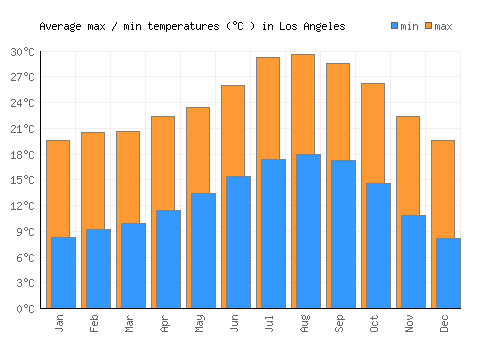
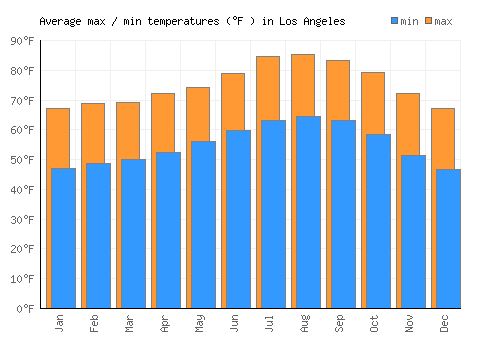
| Jan | Feb | Mar | Apr | May | Jun | Jul | Aug | Sep | Oct | Nov | Dec | |
|---|---|---|---|---|---|---|---|---|---|---|---|---|
| Min °C | 8.3 | 9.3 | 10 | 11.4 | 13.4 | 15.4 | 17.4 | 18 | 17.3 | 14.6 | 10.9 | 8.2 |
| Max °C | 19.6 | 20.6 | 20.7 | 22.4 | 23.5 | 26 | 29.2 | 29.6 | 28.6 | 26.2 | 22.4 | 19.6 |
| Min °F | 46.9 | 48.7 | 49.9 | 52.5 | 56 | 59.7 | 63.3 | 64.4 | 63.1 | 58.3 | 51.5 | 46.8 |
| Max °F | 57 | 58.8 | 59.5 | 62.4 | 65.1 | 69.3 | 73.9 | 74.8 | 73.2 | 68.7 | 61.9 | 57 |
Sea temperature
The graph below shows the average sea temperature.
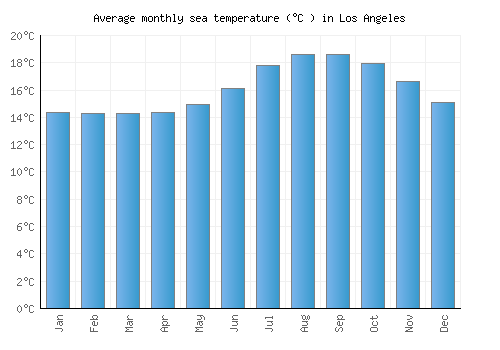
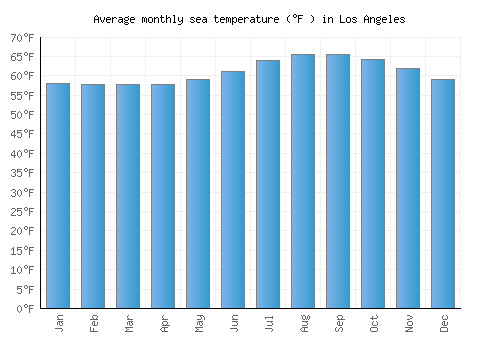
| Jan | Feb | Mar | Apr | May | Jun | Jul | Aug | Sep | Oct | Nov | Dec | |
|---|---|---|---|---|---|---|---|---|---|---|---|---|
| °C | 14.4 | 14.3 | 14.3 | 14.3 | 15 | 16.1 | 17.8 | 18.6 | 18.6 | 17.9 | 16.6 | 15.1 |
| °F | 57.9 | 57.7 | 57.7 | 57.8 | 59 | 61.1 | 64 | 65.5 | 65.5 | 64.3 | 61.9 | 59.1 |
Wind speed
The graph below shows the average wind speed.
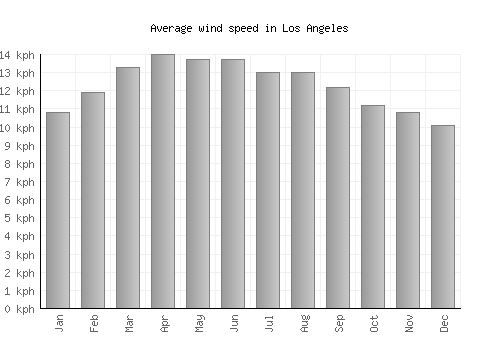
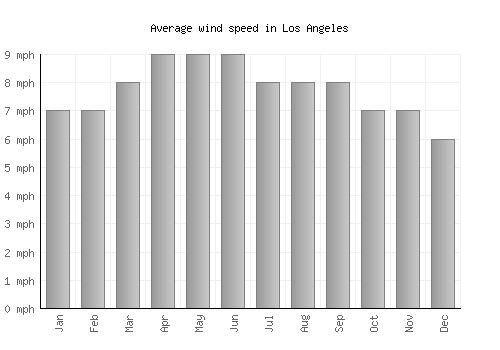
| Jan | Feb | Mar | Apr | May | Jun | Jul | Aug | Sep | Oct | Nov | Dec | |
|---|---|---|---|---|---|---|---|---|---|---|---|---|
| km/h | 11 | 12 | 13 | 14 | 14 | 14 | 13 | 13 | 12 | 11 | 11 | 10 |
| mph | 7 | 7 | 8 | 9 | 9 | 9 | 8 | 8 | 8 | 7 | 7 | 6 |
A monthly average windspeed of over 16km/h or 10mph suggests a location is fairly windy.
Relative humidity
The graph below shows the average relative humidity.
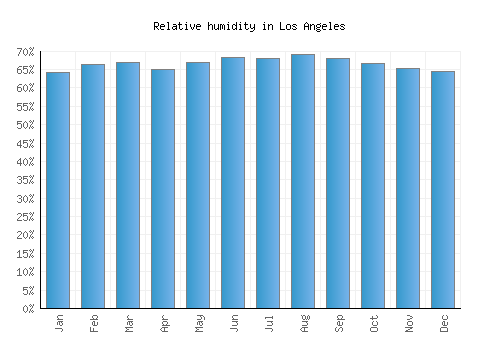
| Jan | Feb | Mar | Apr | May | Jun | Jul | Aug | Sep | Oct | Nov | Dec |
|---|---|---|---|---|---|---|---|---|---|---|---|
| 64% | 67% | 67% | 65% | 67% | 68% | 68% | 69% | 68% | 67% | 65% | 65% |

Other monthly averages
Los Angeles weather stats
| Hottest month: | August | 29.3°C 84.7°F |
|---|---|---|
| Driest month: | July | 1mm 0ins |
| Sunniest month: | August | 11.7hrs |
| Coldest month: | January | 19.3°C 66.7°F |
| Wettest month: | January | 80mm 3.1ins |
| Warmest sea: | September | 18.6°C 65.5°F |
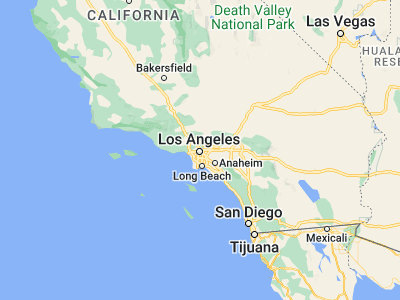

Locations nearby
Top United States locations
- Anaheim
- Anchorage
- Aspen
- Atlanta
- Boston
- Breckenridge
- Charleston
- Chicago
- Coney Island
- Dallas
- Death Valley
- Denver
- Destin
- Detroit
- Glacier National Park
- Grand Canyon
- Honolulu
- Houston
- Indianapolis
- Key West
- Lake Tahoe
- Las Vegas
- Los Angeles
- Malibu
- Manhattan
- Memphis
- Miami
- Minneapolis
- Myrtle Beach
- New Orleans
- New York City
- Niagara Falls
- Ocean City
- Orlando
- Palm Springs
- Philadelphia
- Phoenix
- Salt Lake City
- San Diego
- San Francisco
- Scottsdale
- Seattle
- Sedona
- Sonoma
- Washington, D. C.
- Yosemite National Park
- Zion National Park