Kissimmee (FL) monthly weather averages
Average daytime temperature
The bar chart below shows the average monthly peak daytime temperatures at Kissimmee
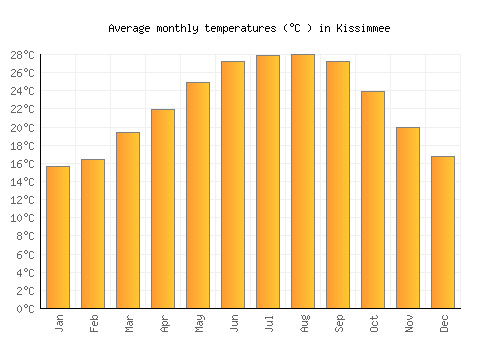
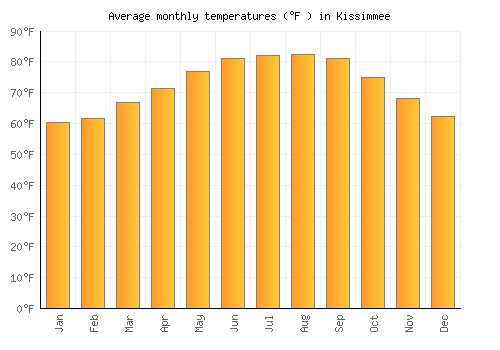
| Jan | Feb | Mar | Apr | May | Jun | Jul | Aug | Sep | Oct | Nov | Dec | |
|---|---|---|---|---|---|---|---|---|---|---|---|---|
| °C | 21.6 | 22.4 | 25.4 | 28.1 | 30.7 | 32.2 | 32.9 | 32.9 | 31.9 | 29 | 25.6 | 22.6 |
| °F | 70.9 | 72.4 | 77.7 | 82.6 | 87.3 | 90 | 91.1 | 91.1 | 89.4 | 84.2 | 78 | 72.6 |
Please note: these are the average peak daytime temperatures (usually around mid-afternoon) so do not show daytime / night highs and lows. To see the daily range of temperatures have a look at the temperature max / min chart below.
Average rainfall & rainy days
The graph below shows the average rainfall and number of rainy days per month.
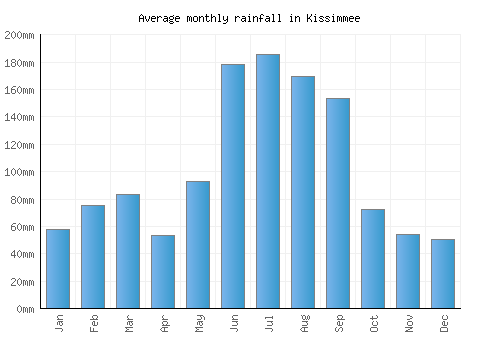
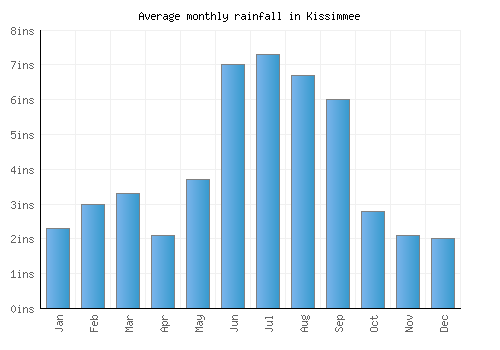
| Jan | Feb | Mar | Apr | May | Jun | Jul | Aug | Sep | Oct | Nov | Dec | |
|---|---|---|---|---|---|---|---|---|---|---|---|---|
| mm | 58 | 75 | 84 | 53 | 93 | 178 | 186 | 170 | 154 | 72 | 54 | 50 |
| inches | 2.3 | 3 | 3.3 | 2.1 | 3.7 | 7 | 7.3 | 6.7 | 6 | 2.8 | 2.1 | 2 |
| Rainy days | 7 | 7 | 7 | 4 | 9 | 14 | 16 | 16 | 13 | 8 | 7 | 6 |
Average annual rainfall in Kissimmee: 1172.733mm (461.7 inches)
Average daily sunshine
The bar chart below shows the average daily sunshine hours in Kissimmee
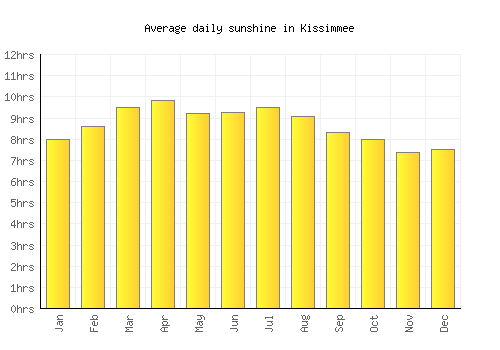
| Jan | Feb | Mar | Apr | May | Jun | Jul | Aug | Sep | Oct | Nov | Dec | |
|---|---|---|---|---|---|---|---|---|---|---|---|---|
| Hrs sunshine | 8 | 8.6 | 9.5 | 9.8 | 9.2 | 9.2 | 9.5 | 9.1 | 8.3 | 8 | 7.4 | 7.5 |
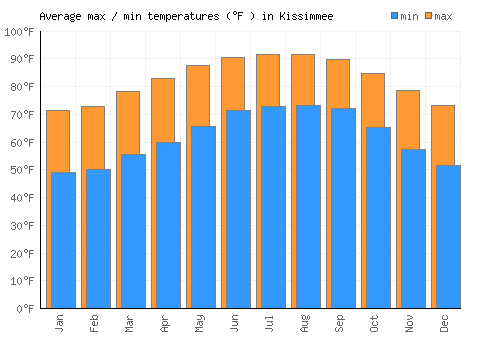
Day / night temperatures
The graph below shows the daily range of temperatures for each month.
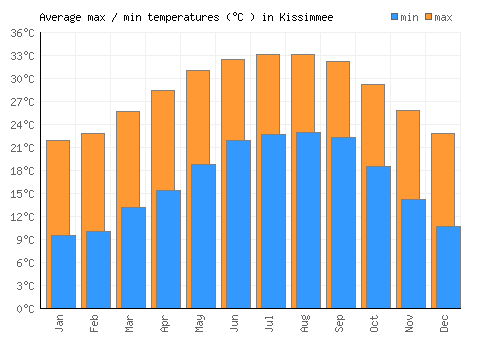
| Jan | Feb | Mar | Apr | May | Jun | Jul | Aug | Sep | Oct | Nov | Dec | |
|---|---|---|---|---|---|---|---|---|---|---|---|---|
| Min °C | 9.5 | 10.1 | 13.1 | 15.4 | 18.8 | 21.9 | 22.7 | 22.9 | 22.3 | 18.6 | 14.2 | 10.8 |
| Max °C | 21.9 | 22.8 | 25.7 | 28.4 | 31 | 32.5 | 33.1 | 33.1 | 32.2 | 29.3 | 25.9 | 22.9 |
| Min °F | 49.1 | 50.1 | 55.6 | 59.7 | 65.8 | 71.4 | 72.9 | 73.2 | 72.1 | 65.4 | 57.5 | 51.4 |
| Max °F | 60.3 | 61.5 | 66.9 | 71.4 | 76.8 | 81 | 82.2 | 82.4 | 81 | 75 | 68 | 62.2 |
Sea temperature
The graph below shows the average sea temperature.
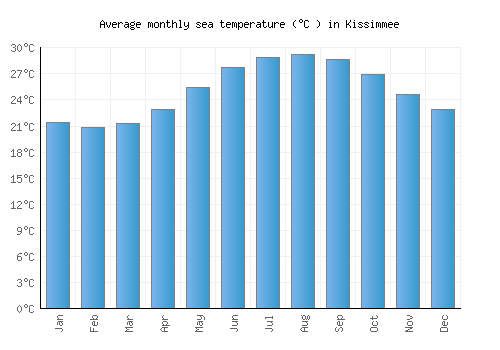
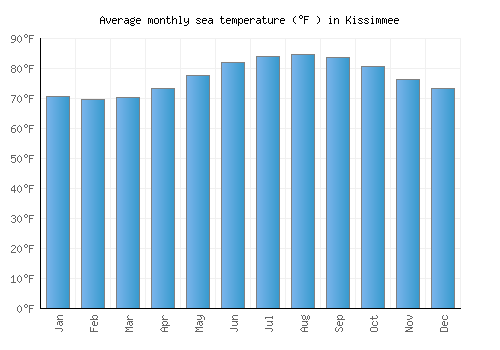
| Jan | Feb | Mar | Apr | May | Jun | Jul | Aug | Sep | Oct | Nov | Dec | |
|---|---|---|---|---|---|---|---|---|---|---|---|---|
| °C | 21.5 | 20.9 | 21.3 | 22.9 | 25.4 | 27.7 | 28.9 | 29.2 | 28.7 | 27 | 24.6 | 22.9 |
| °F | 70.6 | 69.6 | 70.3 | 73.2 | 77.7 | 81.9 | 84 | 84.6 | 83.6 | 80.6 | 76.3 | 73.2 |
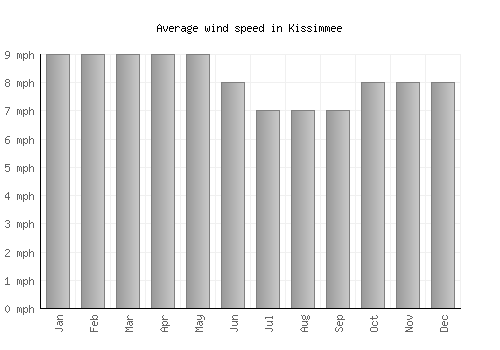
Wind speed
The graph below shows the average wind speed.
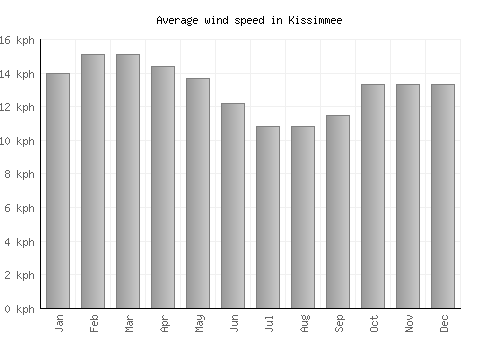
| Jan | Feb | Mar | Apr | May | Jun | Jul | Aug | Sep | Oct | Nov | Dec | |
|---|---|---|---|---|---|---|---|---|---|---|---|---|
| km/h | 14 | 15 | 15 | 14 | 14 | 12 | 11 | 11 | 12 | 13 | 13 | 13 |
| mph | 9 | 9 | 9 | 9 | 9 | 8 | 7 | 7 | 7 | 8 | 8 | 8 |
A monthly average windspeed of over 16km/h or 10mph suggests a location is fairly windy.
Relative humidity
The graph below shows the average relative humidity.
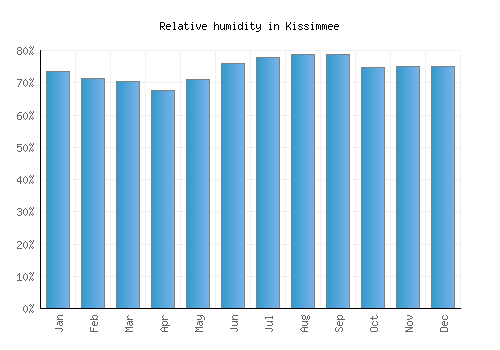
| Jan | Feb | Mar | Apr | May | Jun | Jul | Aug | Sep | Oct | Nov | Dec |
|---|---|---|---|---|---|---|---|---|---|---|---|
| 74% | 72% | 71% | 68% | 71% | 76% | 78% | 79% | 79% | 75% | 75% | 75% |

Other monthly averages
Kissimmee weather stats
| Hottest month: | August | 32.9°C 91.2°F |
|---|---|---|
| Driest month: | December | 50mm 2ins |
| Sunniest month: | March | 9.5hrs |
| Coldest month: | January | 21.6°C 70.9°F |
| Wettest month: | July | 186mm 7.3ins |
| Warmest sea: | August | 29.2°C 84.6°F |

Locations nearby
Top United States locations
- Anaheim
- Anchorage
- Aspen
- Atlanta
- Boston
- Breckenridge
- Charleston
- Chicago
- Coney Island
- Dallas
- Death Valley
- Denver
- Destin
- Detroit
- Glacier National Park
- Grand Canyon
- Honolulu
- Houston
- Indianapolis
- Key West
- Lake Tahoe
- Las Vegas
- Los Angeles
- Malibu
- Manhattan
- Memphis
- Miami
- Minneapolis
- Myrtle Beach
- New Orleans
- New York City
- Niagara Falls
- Ocean City
- Orlando
- Palm Springs
- Philadelphia
- Phoenix
- Salt Lake City
- San Diego
- San Francisco
- Scottsdale
- Seattle
- Sedona
- Sonoma
- Washington, D. C.
- Yosemite National Park
- Zion National Park