Lyndon Weather in September
What's the weather like in Lyndon (Kansas) in September 2025?
The climate in Lyndon during September can be summarized as warm, humid and damp.
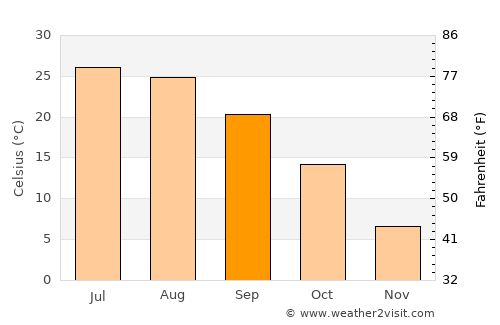
September is in the fall / autumn in Lyndon and is typically the 4th warmest month of the year. Daytime maximum temperatures average around a muggy 27°C (80°F), whilst at night 14°C (57°F) is normal.
| Daytime temperature | 26.8°C 80.2°F |
|---|---|
| Nightly temperature | 13.9°C 56.9°F |
| Average temperature | 20.3°C 68.5°F |
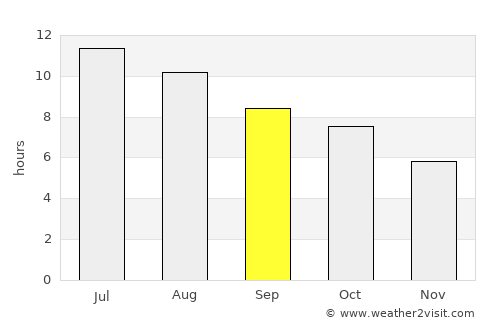
| Daily sunshine | 8.4 hrs |
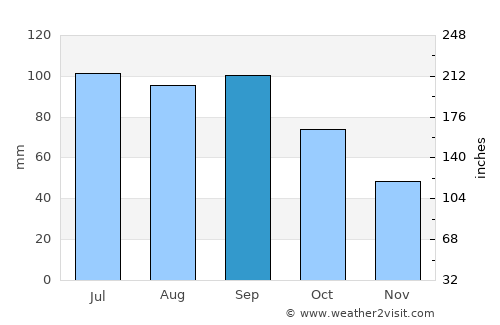
| Avg rainfall | 100 mm 3.9 ins |
| Rainy days | 8 days |
| Sea temperature | 20.6°C 69.1°F |
| Humidity | 71% |
| Windspeed | 15.5kph 10 mph |
On average September is the 4th wettest month of the year in Lyndon with around 100mm 3.9 inches of rain making it a damp time to visit. This rainfall is typically spread over 8 days, although this may vary considerably.
On the flip side this corresponds to an average of 8.4 hours of sunshine per day.
September temperatures in Lyndon
September rainfall
September hourly sunshine
The data used in these monthly averages covers a period of over 100 years right up until last year. As such they are a valid prediction of what to expect for the weather in Lyndon in September 2025.
Other monthly averages
Best places to visit in September
Lyndon weather stats
| Hottest month: | July | 32.1°C 89.8°F |
|---|---|---|
| Driest month: | January | 26mm 1ins |
| Sunniest month: | July | 11.4hrs |
| Coldest month: | January | 2.8°C 37°F |
| Wettest month: | June | 139mm 5.5ins |

Locations nearby
Top United States locations
- Anaheim
- Anchorage
- Aspen
- Atlanta
- Boston
- Breckenridge
- Charleston
- Chicago
- Coney Island
- Dallas
- Death Valley
- Denver
- Destin
- Detroit
- Glacier National Park
- Grand Canyon
- Honolulu
- Houston
- Indianapolis
- Key West
- Lake Tahoe
- Las Vegas
- Los Angeles
- Malibu
- Manhattan
- Memphis
- Miami
- Minneapolis
- Myrtle Beach
- New Orleans
- New York City
- Niagara Falls
- Ocean City
- Orlando
- Palm Springs
- Philadelphia
- Phoenix
- Salt Lake City
- San Diego
- San Francisco
- Scottsdale
- Seattle
- Sedona
- Sonoma
- Washington, D. C.
- Yosemite National Park
- Zion National Park