Woodmont Weather in September
What's the weather like in Woodmont (Connecticut) in September 2025?
The climate in Woodmont during September can be summarized as warm and a little damp.
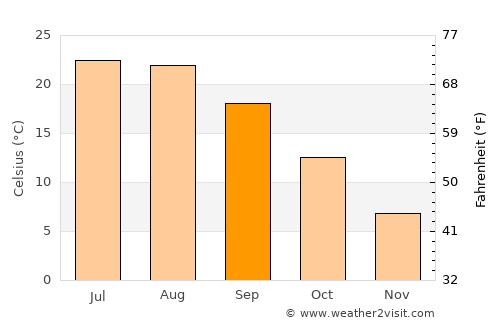
September is in the fall / autumn in Woodmont and is typically the 4th warmest month of the year. Daytime maximum temperatures average around 23°C (74°F), whilst at night 13°C (55°F) is normal.
| Daytime temperature | 23.3°C 73.9°F |
|---|---|
| Nightly temperature | 12.9°C 55.2°F |
| Average temperature | 18.1°C 64.6°F |
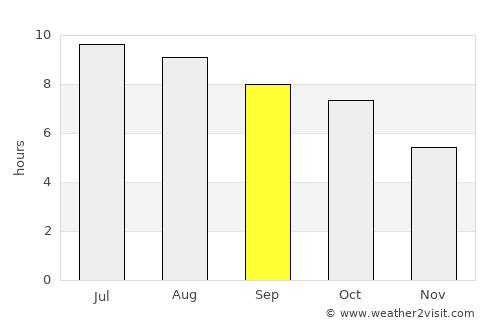
| Daily sunshine | 8 hrs |
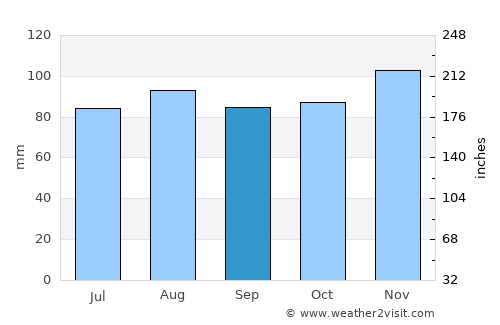
| Avg rainfall | 85 mm 3.3 ins |
| Rainy days | 8 days |
| Sea temperature | 19.6°C 67.3°F |
| Humidity | 74% |
| Windspeed | 15.8kph 10 mph |
On average September is the 5th driest month of the year in Woodmont with around 85mm 3.3 inches of rain making it a a little damp time to visit. This rainfall is typically spread over 8 days, although this may vary considerably.
On the flip side this corresponds to an average of 8 hours of sunshine per day.
September temperatures in Woodmont
September rainfall
September hourly sunshine
The data used in these monthly averages covers a period of over 100 years right up until last year. As such they are a valid prediction of what to expect for the weather in Woodmont in September 2025.
Other monthly averages
Best places to visit in September
Woodmont weather stats
| Hottest month: | July | 27.2°C 81°F |
|---|---|---|
| Driest month: | June | 76mm 3ins |
| Sunniest month: | August | 9.1hrs |
| Coldest month: | January | 1.8°C 35.2°F |
| Wettest month: | November | 103mm 4.1ins |

Locations nearby
Top United States locations
- Anaheim
- Anchorage
- Aspen
- Atlanta
- Boston
- Breckenridge
- Charleston
- Chicago
- Coney Island
- Dallas
- Death Valley
- Denver
- Destin
- Detroit
- Glacier National Park
- Grand Canyon
- Honolulu
- Houston
- Indianapolis
- Key West
- Lake Tahoe
- Las Vegas
- Los Angeles
- Malibu
- Manhattan
- Memphis
- Miami
- Minneapolis
- Myrtle Beach
- New Orleans
- New York City
- Niagara Falls
- Ocean City
- Orlando
- Palm Springs
- Philadelphia
- Phoenix
- Salt Lake City
- San Diego
- San Francisco
- Scottsdale
- Seattle
- Sedona
- Sonoma
- Washington, D. C.
- Yosemite National Park
- Zion National Park